
Page 107 - Statistics and Data Analysis in Geology
P. 107
Analysis of Sequences of Data
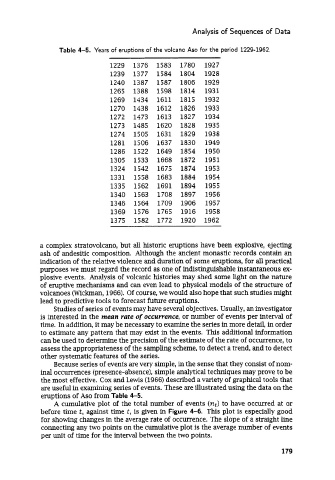
Table 4-5. Years of eruptions of the volcano Aso for the period 1229-1962.
1229 1376 1583 1780 1927
1239 1377 1584 1804 1928
1240 1387 1587 1806 1929
1265 1388 1598 1814 1931
1269 1434 1611 1815 1932
1270 1438 1612 1826 1933
1272 1473 1613 1827 1934
1273 1485 1620 1828 1935
1274 1505 1631 1829 1938
1281 1506 1637 1830 1949
1286 1522 1649 1854 1950
1305 1533 1668 1872 1951
1324 1542 1675 1874 1953
1331 1558 1683 1884 1954
1335 1562 1691 1894 1955
1340 1563 1708 1897 1956
1346 1564 1709 1906 1957
1369 1576 1765 1916 1958
1375 1582 1772 1920 1962
a complex stratovolcano, but all historic eruptions have been explosive, ejecting
ash of andesitic composition. Although the ancient monastic records contain an
indication of the relative violence and duration of some eruptions, for all practical
purposes we must regard the record as one of indistinguishable instantaneous ex-
plosive events. Analysis of volcanic histories may shed some light on the nature
of eruptive mechanisms and can even lead to physical models of the structure of
volcanoes (Wickman, 1966). Of course, we would also hope that such studies might
lead to predictive tools to forecast future eruptions.
Studies of series of events may have several objectives. Usually, an investigator
is interested in the mean rate of occurrence, or number of events per interval of
time. In addition, it may be necessary to examine the series in more detail, in order
to estimate any pattern that may exist in the events. This additional information
can be used to determine the precision of the estimate of the rate of occurrence, to
assess the appropriateness of the sampling scheme, to detect a trend, and to detect
other systematic features of the series.
Because series of events are very simple, in the sense that they consist of nom-
inal occurrences (presence-absence), simple analytical techniques may prove to be
the most effective. Cox and Lewis (1966) described a variety of graphical tools that
are useful in examining series of events. These are illustrated using the data on the
eruptions of Aso from Table 4-5.
A cumulative plot of the total number of events (nt) to have occurred at or
before time t, against time t, is given in Figure 4-6. This plot is especially good
for showing changes in the average rate of occurrence. The slope of a straight line
connecting any two points on the cumulative plot is the average number of events
per unit of time for the interval between the two points.
179