
Page 110 - Statistics and Data Analysis in Geology
P. 110
Statistics and Data Analysis in Geology - Chapter 4
10
0
0 10 20 30 40 50 0
ti+l-tiin years
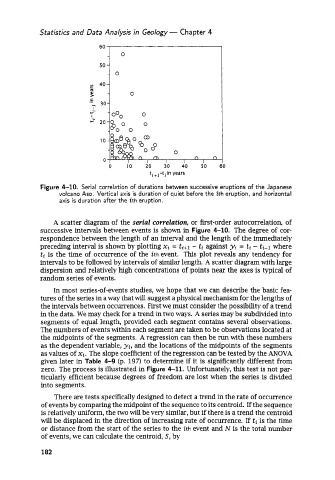
Figure 4-10. Serial correlation of durations between successive eruptions of the Japanese
volcano Aso. Vertical axis is duration of quiet before the ith eruption, and horizontal
axis is duration after the zth eruption.
A scatter diagram of the serial correlation, or first-order autocorrelation, of
successive intervals between events is shown in Figure 4-10. The degree of cor-
respondence between the length of an interval and the length of the immediately
preceding interval is shown by plotting xi = ti+l - ti against yi = ti - ti-1 where
ti is the time of occurrence of the ith event. This plot reveals any tendency for
intervals to be followed by intervals of similar length. A scatter diagram with large
dispersion and relatively high concentrations of points near the axes is typical of
random series of events.
In most series-of-events studies, we hope that we can describe the basic fea-
tures of the series in a way that will suggest a physical mechanism for the lengths of
the intervals between occurrences. First we must consider the possibility of a trend
in the data. We may check for a trend in two ways. A series may be subdivided into
segments of equal length, provided each segment contains several observations.
The numbers of events within each segment are taken to be observations located at
the midpoints of the segments. A regression can then be run with these numbers
as the dependent variable, yi, and the locations of the midpoints of the segments
as values of Xi. The slope coefficient of the regression can be tested by the ANOVA
given later in Table 4-9 (p. 197) to determine if it is significantly different from
zero. The process is illustrated in Figure 4-11. Unfortunately, this test is not par-
ticularly efficient because degrees of freedom are lost when the series is divided
into segments.
There are tests specifically designed to detect a trend in the rate of occurrence
of events by comparing the midpoint of the sequence to its centroid. If the sequence
is relatively uniform, the two will be very similar, but if there is a trend the centroid
will be displaced in the direction of increasing rate of occurrence. If ti is the time
or distance from the start of the series to the ith event and N is the total number
of events, we can calculate the centroid, S, by
182