
Page 108 - Statistics and Data Analysis in Geology
P. 108
Statistics and Data Analysis in Geology - Chapter 4
100
80
60
L
u-
0
L
QJ
n
5 40
z
20
0
1200 1400 1600 1800 2 30
Year of event
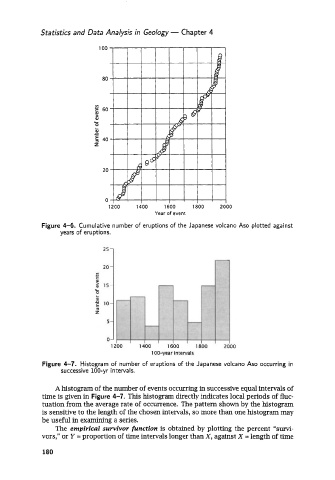
Figure 4-6. Cumulative number of eruptions of the Japanese volcano Aso plotted against
years of eruptions.
Figure 4-7. Histogram of number of eruptions of the Japanese volcano Aso occurring in
successive 100-yr intervals.
A histogram of the number of events occurring in successive equal intervals of
time is given in Figure 4-7. This histogram directly indicates local periods of fluc-
tuation from the average rate of occurrence. The pattern shown by the histogram
is sensitive to the length of the chosen intervals, so more than one histogram may
be useful in examining a series.
The empirical survivor function is obtained by plotting the percent “survi-
vors,” or Y = proportion of time intervals longer than X, against X = length of time
180