
Page 127 - Statistics and Data Analysis in Geology
P. 127
Statistics and Data Analysis in Geology - Chapter 5
0 0 oo ,"I
0 0 0 0 0 0 0 0 0 0 0 0 0 0 O
oo
0 0 0 0 0 0 0 0 0 0 0 0 0 0 OI IiOo
0
0
0
0
0 0 0 0 0 0 0 I
0 0 0 0 0 0 0 0 loo 00 O 0 0 01
0 0 0 0 0 0 0 0 O0 0 0 00 0
0 0 0 0 0 0 0 0 00
0 0 0 0 0 0 0 0 O O O
0 0 0 0 0 0 0 0
0 0 0 0 0 0 0 00
0 0 0 0 0 0 0 0 o o o o o o 0
0 0 0 0 0 0 0 01 j o ooo0 1
0 0 0 0 0 0 0
0 0 0 0 0 0 0 - 0 oo
I U b C
-
0 0 0
O o o
d e
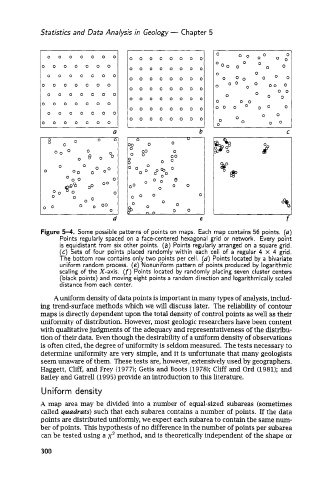
Figure 5-4. Some possible patterns of points on maps. Each map contains 56 points. (a)
Points regularly spaced on a face-centered hexagonal grid or network. Every point
is equidistant from six other points. (b) Points regularly arranged on a square grid.
(c) Sets of four points placed randomly within each cell of a regular 4 x 4 grid.
The bottom row contains only two points per cell. (d) Points located by a bivariate
uniform random process. (e) Nonuniform pattern of points produced by logarithmic
scaling of the X-axis. (f) Points located by randomly placing seven cluster centers
(black points) and moving eight points a random direction and logarithmically scaled
distance from each center.
A uniform density of data points is important in many types of analysis, includ-
ing trend-surface methods which we will discuss later. The reliability of contour
maps is directly dependent upon the total density of control points as well as their
uniformity of distribution. However, most geologic researchers have been content
with qualitative judgments of the adequacy and representativeness of the distribu-
tion of their data. Even though the desirability of a uniform density of observations
is often cited, the degree of uniformity is seldom measured. The tests necessary to
determine uniformity are very simple, and it is unfortunate that many geologists
seem unaware of them. These tests are, however, extensively used by geographers.
Haggett, Cliff, and Frey (1977); Getis and Boots (1978); Cliff and Ord (1981); and
Bailey and Gatrell(l995) provide an introduction to this literature.
Uniform density
.A map area may be divided into a number of equal-sized subareas (sometimes
called quadrats) such that each subarea contains a number of points. If the data
points are distributed uniformly, we expect each subarea to contain the same num-
ber of points. This hypothesis of no difference in the number of points per subarea
(:an be tested using a x2 method, and is theoretically independent of the shape or
300