
Page 128 - Statistics and Data Analysis in Geology
P. 128
Spatial Analysis
0
0 0
00 0
0 0
5 4 OO 0 (1
00 0
U
0 0
10
I 00 00
0 0 oc
C I
% 15- " 0 % 0" 0 0
0
L - 0 0
0
0
0
z m o 0000 3 0 00
00 0 0 0 0
0
0 oo O 000 0 0
m
U U
254 0 00 0 O;I 0 0 0 0
b
0
b
15 20 25 30 35 40
Easting
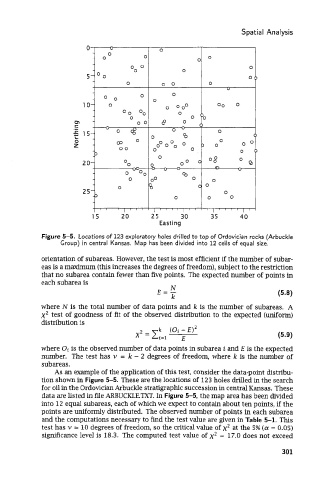
Figure 5-5. Locations of 123 exploratory holes drilled to top of Ordovician rocks (Arbuckle
Group) in central Kansas. Map has been divided into 12 cells of equal size.
orientation of subareas. However, the test is most efficient if the number of subar-
eas is a maximum (this increases the degrees of freedom), subject to the restriction
that no subarea contain fewer than five points. The expected number of points in
each subarea is
N
E=- (5.8)
k
where N is the total number of data points and k is the number of subareas. A
x2 test of goodness of fit of the observed distribution to the expected (uniform)
distribution is
where Oi is the observed number of data points in subarea i and E is the expected
number. The test has v = k - 2 degrees of freedom, where k is the number of
subareas.
As an example of the application of this test, consider the data-point distribu-
tion shown in Figure 5-5. These are the locations of 123 holes drilled in the search
for oil in the Ordovician Arbuckle stratigraphic succession in central Kansas. These
data are listed in file ARBUCKLE.TXT. In Figure 5-5, the map area has been divided
into 12 equal subareas, each of which we expect to contain about ten points, if the
points are uniformly distributed. The observed number of points in each subarea
and the computations necessary to find the test value are given in Table 5-1. This
test has v = 10 degrees of freedom, so the critical value of x2 at the 5% (a = 0.05)
significance level is 18.3. The computed test value of x2 = 17.0 does not exceed
301