
Page 133 - Statistics and Data Analysis in Geology
P. 133
Statistics and Data Analysis in Geology - Chapter 5
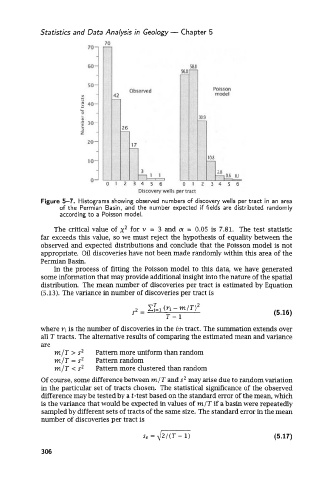
Figure 5-7. Histograms showing observed numbers of discovery wells per tract in an area
of the Permian Basin, and the number expected if fields are distributed randomly
according to a Poisson model.
The critical value of x2 for v = 3 and (x = 0.05 is 7.81. The test statistic
far exceeds this value, so we must reject the hypothesis of equality between the
observed and expected distributions and conclude that the Poisson model is not
appropriate. Oil discoveries have not been made randomly within this area of the
Permian Basin.
In the process of fitting the Poisson model to this data, we have generated
some information that may provide additional insight into the nature of the spatial
distribution. The mean number of discoveries per tract is estimated by Equation
(5.13). The variance in number of discoveries per tract is
(5.16)
where ri is the number of discoveries in the ith tract. The summation extends over
all T tracts. The alternative results of comparing the estimated mean and variance
are
m/T > s2 Pattern more uniform than random
m/T = s2 Pattern random
m/T < s2 Pattern more clustered than random
Of course, some difference between mlT and s2 may arise due to random variation
in the particular set of tracts chosen. The statistical significance of the observed
difference may be tested by a t-test based on the standard error of the mean, which
is the variance that would be expected in values of m/T if a basin were repeatedly
sampled by different sets of tracts of the same size. The standard error in the mean
number of discoveries per tract is
(5.17)
306