
Page 136 - Statistics and Data Analysis in Geology
P. 136
Spatial Analysis
Table 5-3. Expected numbers of tracts containing Y discoveries in eastern
part of Permian Basin, Texas, assuming a negative binomial distribution.
Number of Probability Number of Tracts
Discoveries Tract Contains
Per Tract (Y) Y Discoveries Expected Observed
0 0.4124 66.0 70
1 0.3112 49.8 42
2 0.1611 25.8 26
3 0.0706 11.3 17
4 0.0281 4.5 3
5 0.0106 1.7 1
6 0.0038 0.6 2
TOTALS 0.9988 159.7 160
Discovery wells per tract
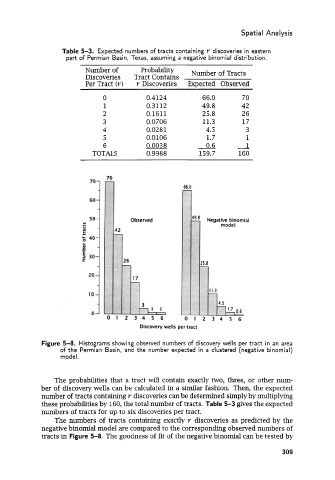
Figure 5-8. Histograms showing observed numbers of discovery wells per tract in an area
of the Permian Basin, and the number expected in a clustered (negative binomial)
model.
The probabilities that a tract will contain exactly two, three, or other num-
ber of discovery wells can be calculated in a similar fashion. Then, the expected
number of tracts containing Y discoveries can be determined simply by multiplying
these probabilities by 160, the total number of tracts. Table 5-3 gives the expected
numbers of tracts for up to six discoveries per tract.
The numbers of tracts containing exactly Y discoveries as predicted by the
negative binomial model are compared to the corresponding observed numbers of
tracts in Figure 5-8. The goodness of fit of the negative binomial can be tested by
309