
Page 140 - Statistics and Data Analysis in Geology
P. 140
Spat i a I An a I ysis
100-
4 4
- 4
4
4 44 4
80-
4 4
- 4
60 - 4 4
r 4 t
I
.- - 4
E
Y
s 4
S
40- 1
4
- 4'
4 4
20- '4 '
- 4 4
4
4 4 4 4 4 4
OJ
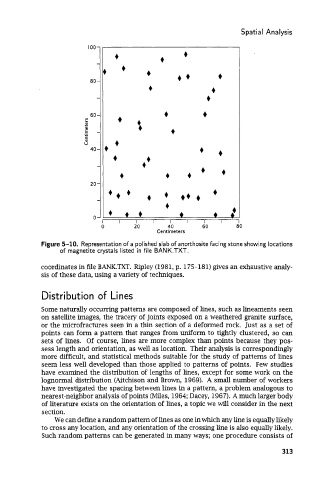
Figure 5-10. Representation of a polished slab of anorthosite facing stone showing locations
of magnetite crystals listed in file BANK.TXT.
coordinates in file BANK.TXT. Ripley (1981, p. 175-181) gives an exhaustive analy-
sis of these data, using a variety of techniques.
Distribution of Lines
Some naturally occurring patterns are composed of lines, such as lineaments seen
on satellite images, the tracery of joints exposed on a weathered granite surface,
or the microfractures seen in a thin section of a deformed rock. Just as a set of
points can form a pattern that ranges from uniform to tightly clustered, so can
sets of lines. Of course, lines are more complex than points because they pos-
sess length and orientation, as well as location. Their analysis is correspondingly
more difficult, and statistical methods suitable for the study of patterns of lines
seem less well developed than those applied to patterns of points. Few studies
have examined the distribution of lengths of lines, except for some work on the
lognormal distribution (Aitchison and Brown, 1969). A small number of workers
have investigated the spacing between lines in a pattern, a problem analogous to
nearest-neighbor analysis of points (Miles, 1964; Dacey, 1967). A much larger body
of literature exists on the orientation of lines, a topic we will consider in the next
section.
We can define a random pattern of lines as one in which any line is equally likely
to cross any location, and any orientation of the crossing line is also equally likely.
Such random patterns can be generated in many ways; one procedure consists of
313