
Page 145 - Statistics and Data Analysis in Geology
P. 145
Statistics and Data Analysis in Geology - Chapter 5
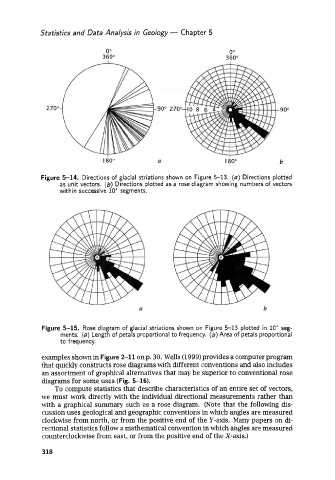
Figure 5-14. Directions of glacial striations shown on Figure 5-13. (a) Directions plotted
as unit vectors. (b) Directions plotted as a rose diagram showing numbers of vectors
within successive 10" segments.
Figure 5-15. Rose diagram of glacial striations shown on Figure 5-13 plotted in 10" seg-
ments. (a) Length of petals proportional to frequency. (b) Area of petals proportional
to frequency.
examples shownin Figure 2-11 onp. 30. Wells (1999) provides a computer program
that quickly constructs rose diagrams with different conventions and also includes
an assortment of graphical alternatives that may be superior to conventional rose
diagrams for some uses (Fig. 5-16).
To compute statistics that describe characteristics of an entire set of vectors,
we must work directly with the individual directional measurements rather than
with a graphical summary such as a rose diagram. (Note that the following dis-
cussion uses geological and geographic conventions in which angles are measured
clockwise from north, or from the positive end of the Y-axis. Many papers on di-
rectional statistics follow a mathematical convention in which angles are measured
counterclockwise from east, or from the positive end of the X-axis.)
318