
Page 150 - Statistics and Data Analysis in Geology
P. 150
Analysis of Multivariate Data
Although we regarded this problem as involving only one independent variable
(or two, in the case of trend-surface analysis as discussed in Chapter 5), it can be
regarded as containing m independent variables. This can readily be seen if we
rewrite the model equation as
yi = /30 + BlXli + /3ZXZi + - * ‘ + /3mxmi + Ei (6.4)
and define the variables as x1 = XI, xg = x:, x3 = x:, and so forth. Thus, the
regression procedures we have considered up to this point have simply involved
the definition of the independent variables in a specific manner.
A regression of any m independent variables upon a dependent variable can be
expressed as in Equation (6.4). The normal equations that will yield a least-squares
solution can be found by appropriate labeling of the rows and columns of the matrix
equation and cross multiplying to find the entries in the body of the matrix. For
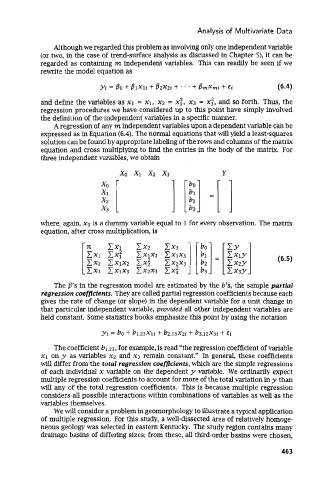
three independent variables, we obtain
where, again, xo is a dummy variable equal to 1 for every observation. The matrix
equation, after cross multiplication, is
The 6’s in the regression model are estimated by the b’s, the sample partial
regression coefficients. They are called partial regression coefficients because each
gives the rate of change (or slope) in the dependent variable for a unit change in
that particular independent variable, provided all other independent variables are
held constant. Some statistics books emphasize this point by using the notation
The coefficient b1.23, for example, is read “the regression coefficient of variable
x1 on y as variables xg and x3 remain constant.” In general, these coefficients
will differ from the total regression coefficients, which are the simple regressions
of each individual x variable on the dependent y variable. We ordinarily expect
multiple regression coefficients to account for more of the total variation in y than
will any of the total regression coefficients. This is because multiple regression
considers all possible interactions within combinations of variables as well as the
variables themselves.
We will consider a problem in geomorphology to illustrate a typical application
of multiple regression. For this study, a well-dissected area of relatively homoge-
neous geology was selected in eastern Kentucky. The study region contains many
drainage basins of differing sizes; from these, all third-order basins were chosen,
463