
Page 151 - Statistics and Data Analysis in Geology
P. 151
Statistics and Data Analysis in Geology - Chapter 6
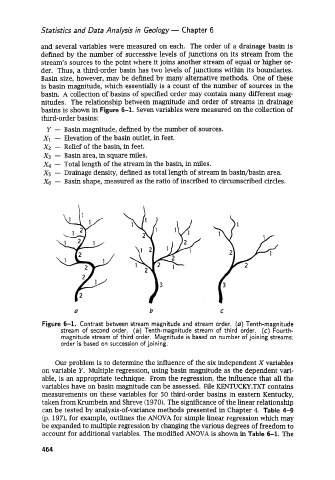
and several variables were measured on each. The order of a drainage basin is
defined by the number of successive levels of junctions on its stream from the
stream’s sources to the point where it joins another stream of equal or higher or-
der. Thus, a third-order basin has two levels of junctions within its boundaries.
Basin size, however, may be defined by many alternative methods. One of these
is basin magnitude, which essentially is a count of the number of sources in the
basin. A collection of basins of specified order may contain many different mag-
nitudes. The relationship between magnitude and order of streams in drainage
basins is shown in Figure 6-1. Seven variables were measured on the collection of
third-order basins:
Y- Basin magnitude, defined by the number of sources.
x1 - Elevation of the basin outlet, in feet.
XZ - Relief of the basin, in feet.
x3 - Basin area, in square miles.
x4 - Total length of the stream in the basin, in miles.
xs - Drainage density, defined as total length of stream in basinbasin area.
x6 - Basin shape, measured as the ratio of inscribed to circumscribed circles.
Y
1
a 2 b C
Figure 6-1. Contrast between stream magnitude and stream order. (a) Tenth-magnitude
stream of second order. (b) Tenth-magnitude stream of third order. (c) Fourth-
magnitude stream of third order. Magnitude is based on number of joining streams;
order is based on succession of joining.
Our problem is to determine the influence of the six independent X variables
on variable Y. Multiple regression, using basin magnitude as the dependent vari-
able, is an appropriate technique. From the regression, the influence that all the
variables have on basin magnitude can be assessed. File KENTUCKY.TXT contains
measurements on these variables for 50 third-order basins in eastern Kentucky,
taken from Krumbein and Shreve (1970). The significance of the linear relationship
can be tested by analysis-of-variance methods presented in Chapter 4. Table 4-9
(p. 197), for example, outlines the ANOVA for simple linear regression which may
be expanded to multiple regression by changing the various degrees of freedom to
account for additional variables. The modified ANOVA is shown in Table 6-1. The
464