
Page 147 - Statistics and Data Analysis in Geology
P. 147
Next Page
Statistics and Data Analysis in Geology - Chapter 5
I R
U b
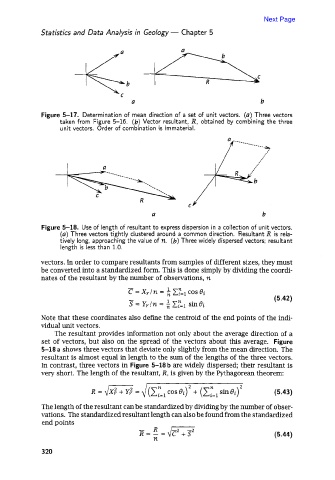
Figure 5-17. Determination of mean direction of a set of unit vectors. (a) Three vectors
taken from Figure 5-16. (b) Vector resultant, R, obtained by combining the three
unit vectors. Order of combination is immaterial.
a b
Figure 5-18. Use of length of resultant to express dispersion in a collection of unit vectors.
(a) Three vectors tightly clustered around a common direction. Resultant R is rela-
tively long, approaching the value of n. (6) Three widely dispersed vectors; resultant
length is less than 1.0.
vectors. In order to compare resultants from samples of different sizes, they must
be converted into a standardized form. This is done simply by dividing the coordi-
nates of the resultant by the number of observations, n
(5.42)
Note that these coordinates also define the centroid of the end points of the indi-
vidual unit vectors.
'The resultant provides information not only about the average direction of a
set of vectors, but also on the spread of the vectors about this average. Figure
5-18 a shows three vectors that deviate only slightly from the mean direction. The
resultant is almost equal in length to the sum of the lengths of the three vectors.
In contrast, three vectors in Figure 5-18 b are widely dispersed; their resultant is
very short. The length of the resultant, R, is given by the Pythagorean theorem:
(5.43)
The length of the resultant can be standardized by dividing by the number of obser-
vations. The standardized resultant length can also be found from the standardized
end points
- R Jn
R=-= C +S (5.44)
n
320