
Page 142 - Statistics and Data Analysis in Geology
P. 142
Spatial Analysis
This allows us to calculate a simple z-statistic for testing the significance of the
difference between the expected and observed mean nearest-neighbor distance:
(5.36)
The test is two-tailed; if the value of z is not significant, we conclude that the
observed pattern of lines cannot be distinguished from a pattern generated by a
random (Poisson) process. We can also create a nearest-neighbor index identical to
that used for point patterns by taking the ratio of the observed and expected mean
--
nearest-neighbor distances, or d/6. The index is interpreted exactly as is the index
for point patterns.
This test will work for sets of lines that are straight or curved, provided the
lines do not reverse direction frequently. Also, the lines should be at least one and
one-half times longer than the average distance between the lines. If the number of
lines on the map is small, the estimated density should be adjusted by the factor
(n - 1) In, where n is the number of lines in the pattern. The estimate of the line
density is, therefore
(n- l)L
A= (5.37)
nA
A simple alternative way of investigating the nature of a set of lines on a map in-
volves converting the two-dimensional pattern into a one-dimensional sequence.
We can do this by drawing a sampling line at random across the map and not-
ing where the line intersects the lines in the pattern. The distribution of intervals
between the points of intersection along the sampling line will provide informa-
tion about the spatial pattern. We can test this one-dimensional sequence using
methods presented in Chapter 4. If a single sampling line does not provide enough
intersections for a valid test, we can draw a randomly oriented continuation of
the sampling line from the point where the sampling line intersects the last line
on the map, and a second randomly oriented continuation from the last line on
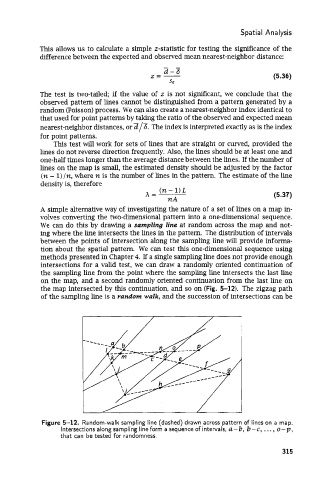
the map intersected by this continuation, and so on (Fig. 5-12). The zigzag path
of the sampling line is a random walk, and the succession of intersections can be
Figure 5-12. Random-walk sampling line (dashed) drawn across pattern of lines on a map.
Intersections along sampling line form a sequence of intervals, a-b, b-c, , . , , o-p,
that can be tested for randomness.
315