
Page 144 - Statistics and Data Analysis in Geology
P. 144
Spatial Analysis
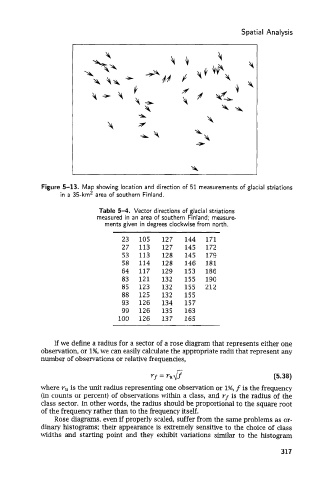
Figure 5-13. Map showing location and direction of 51 measurements of glacial striations
in a 35-km2 area of southern Finland.
Table 5-4. Vector directions of glacial striations
measured in an area of southern Finland; measure-
ments given in degrees clockwise from north.
23 105 127 144 171
27 113 127 145 172
53 113 128 145 179
58 114 128 146 181
64 117 129 153 186
83 121 132 155 190
85 123 132 155 212
88 125 132 155
93 126 134 157
99 126 135 163
100 126 137 165
If we define a radius for a sector of a rose diagram that represents either one
observation, or 1%, we can easily calculate the appropriate radii that represent any
number of observations or relative frequencies,
Yf = Yufi (5.38)
where r, is the unit radius representing one observation or 1%, f is the frequency
(in counts or percent) of observations within a class, and yf is the radius of the
class sector. In other words, the radius should be proportional to the square root
of the frequency rather than to the frequency itself.
Rose diagrams, even if properly scaled, suffer from the same problems as or-
dinary histograms; their appearance is extremely sensitive to the choice of class
widths and starting point and they exhibit variations similar to the histogram
317