
Page 141 - Statistics and Data Analysis in Geology
P. 141
Statistics and Data Analysis in Geology - Chapter 5
I
%/
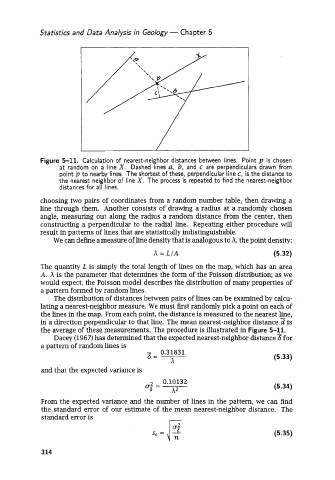
Figure 5-11. Calculation of nearest-neighbor distances between lines. Point p is chosen
at random on a line X. Dashed lines U, b, and c are perpendiculars drawn from
point p to nearby lines. The shortest of these, perpendicular line c, is the distance to
the nearest neighbor of line X. The process is repeated to find the nearest-neighbor
distances for all lines.
choosing two pairs of coordinates from a random number table, then drawing a
line through them. Another consists of drawing a radius at a randomly chosen
angle, measuring out along the radius a random distance from the center, then
constructing a perpendicular to the radial line. Repeating either procedure will
result in patterns of lines that are statistically indistinguishable.
We can define a measure of line density that is analogous to A, the point density:
h = L/A (5.32)
The quantity L is simply the total length of lines on the map, which has an area
A. h is the parameter that determines the form of the Poisson distribution; as we
would expect, the Poisson model describes the distribution of many properties of
a pattern formed by random lines.
The distribution of distances between pairs of lines can be examined by calcu-
lating a nearest-neighbor measure. We must first randomly pick a point on each of
the lines in the map. From each point, the distance is measured to the nearest line,
in a direction perpendicular to that line. The mean nearest-neighbor distance 2 is
the average of these measurements. The procedure is illustrated in Figure 5-11.
Dacey (1967) has determined that the expected nearest-neighbor distance 8 for
a Dattern of random lines is
- 0.31831
6= (5.33)
h
and that the expected variance is
0.10132
=
0-2. (5.34)
6 h2
From the expected variance and the number of lines in the pattern, we can find
the standard error of our estimate of the mean nearest-neighbor distance. The
standard error is r
n (5.35)
314