
Page 139 - Statistics and Data Analysis in Geology
P. 139
Statistics and Data Analysis in Geology - Chapter 5
0 0 00 0 % 0
0 0 0 0 0 0 0 0 0 0 00 00
0 0 0 0 0 0 0 0 0 0 0 0 oooooo
0
0 0 0 0 0 0 0 0 0 0 $0 0 0 0
0 008 oo
0 0 0 0 0 0 0 0 0 0 0
0 0 0 0
0 0 0 0 0 0 0 0 0 0 O O 0
0 0 0 0
0 0 0 0 0 0 0 0 0 0 00 0
0 0 Bo OOO 0 0
0 0 0 0 0 0 0 0 0 0 0 0 0
0 0 0 0 0 OO 00 00
0 0 0 0 0 0 0 0 0 0 0 0 0 0 O n
a b
-
00 0 0 %
0 0
00 0
0
O O
o oe
0
0
0
00 O 0 00 0
0 0 OQ 00
0 8
DO 0
0 0 cDo
- n 0
a f
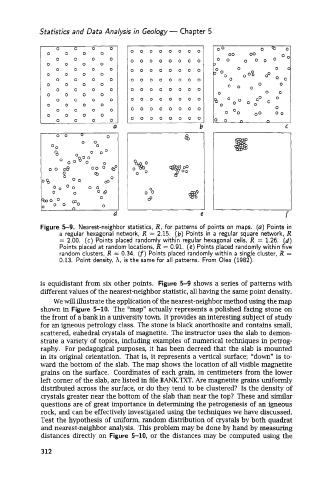
Figure 5-9. Nearest-neighbor statistics, R, for patterns of points on maps. (a) Points in
a regular hexagonal network, R = 2.15. (b) Points in a regular square network, R
= 2.00. (c) Points placed randomly within regular hexagonal cells, R = 1.26. (d)
Points placed at random locations, R = 0.91. (e) Points placed randomly within five
random clusters, R = 0.34. (f) Points placed randomly within a single cluster, R =
0.13. Point density, A, is the same for all patterns. From Olea (1982).
is equidistant from six other points. Figure 5-9 shows a series of patterns with
different values of the nearest-neighbor statistic, all having the same point density.
We will illustrate the application of the nearest-neighbor method using the map
shown in Figure 5-10. The “map” actually represents a polished facing stone on
the front of a bank in a university town. It provides an interesting subject of study
for an igneous petrology class. The stone is black anorthosite and contains small,
scattered, euhedral crystals of magnetite. The instructor uses the slab to demon-
strate a variety of topics, including examples of numerical techniques in petrog-
raphy. For pedagogical purposes, it has been decreed that the slab is mounted
in its original orientation. That is, it represents a vertical surface; “down” is to-
ward the bottom of the slab. The map shows the location of all visible magnetite
grains on the surface. Coordinates of each grain, in centimeters from the lower
left corner of the slab, are listed in file BANK.TXT. Are magnetite grains uniformly
distributed across the surface, or do they tend to be clustered? Is the density of
crystals greater near the bottom of the slab than near the top? These and similar
questions are of great importance in determining the petrogenesis of an igneous
rock, and can be effectively investigated using the techniques we have discussed.
Test the hypothesis of uniform, random distribution of crystals by both quadrat
and nearest-neighbor analysis. This problem may be done by hand by measuring
distances directly on Figure 5-10, or the distances may be computed using the
312