
Page 129 - Statistics and Data Analysis in Geology
P. 129
Statistics and Data Analysis in Geology - Chapter 5
this, so we conclude that there is no evidence suggesting that the quadrats are
unevenly populated. Note that the test applies only to the uniformity of point den-
sities between areas of a specified size and shape. It is possible that we could
select quadrats of different sizes or shapes that might not be uniformly populated,
especially if they were smaller than those used in this test.
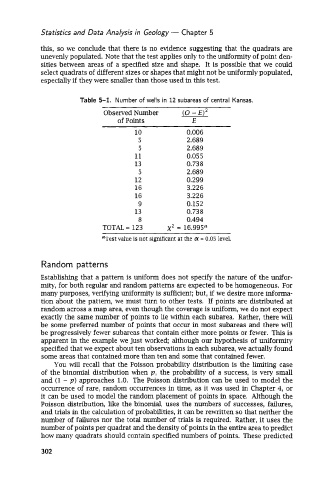
Table 5-1. Number of wells in 12 subareas of central Kansas.
Observed Number (0 - E)*
of Points E
10 0.006
5 2.689
5 2.689
11 0.055
13 0.738
5 2.689
12 0.299
16 3.226
16 3.226
9 0.152
13 0.738
8 0.494
TOTAL = 123 x2 = 16.995"
aTest value is not significant at the a = 0.05 level.
Random patterns
Establishing that a pattern is uniform does not specify the nature of the unifor-
mity, for both regular and random patterns are expected to be homogeneous. For
many purposes, verifying uniformity is sufficient; but, if we desire more informa-
tion about the pattern, we must turn to other tests. If points are distributed at
random across a map area, even though the coverage is uniform, we do not expect
exactly the same number of points to lie within each subarea. Rather, there will
be some preferred number of points that occur in most subareas and there will
be progressively fewer subareas that contain either more points or fewer. This is
apparent in the example we just worked: although our hypothesis of uniformity
specified that we expect about ten observations in each subarea, we actually found
some areas that contained more than ten and some that contained fewer.
You will recall that the Poisson probability distribution is the limiting case
of the binomial distribution when p, the probability of a success, is very small
and (1 - p) approaches 1.0. The Poisson distribution can be used to model the
occurrence of rare, random occurrences in time, as it was used in Chapter 4, or
it can be used to model the random placement of points in space. Although the
Poisson distribution, like the binomial, uses the numbers of successes, failures,
and trials in the calculation of probabilities, it can be rewritten so that neither the
number of failures nor the total number of trials is required. Rather, it uses the
number of points per quadrat and the density of points in the entire area to predict
how many quadrats should contain specified numbers of points. These predicted
302