
Page 170 - Statistics and Data Analysis in Geology
P. 170
Analysis of Multivariate Data
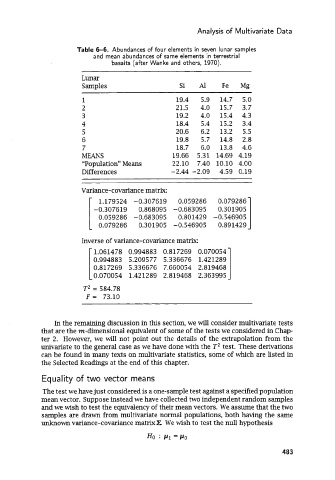
Table 6-6. Abundances of four elements in seven lunar samples
and mean abundances of same elements in terrestrial
basalts (after Wanke and others, 1970).
Lunar
Samples Si Al Fe Mg
1 19.4 5.9 14.7 5.0
2 21.5 4.0 15.7 3.7
3 19.2 4.0 15.4 4.3
4 18.4 5.4 15.2 3.4
5 20.6 6.2 13.2 5.5
6 19.8 5.7 14.8 2.8
7 18.7 6.0 13.8 4.6
MEANS 19.66 5.31 14.69 4.19
“Population” Means 22.10 7.40 10.10 4.00
Differences -2.44 -2.09 4.59 0.19
Variance-covariance matrix:
1.179524 -0.307619 0.059286 0.079286
-0.307619 0.868095 -0.683095 0.301905 1
0.059286 -0.683095 0.801429 -0.546905
0.079286 0.301905 -0.546905 0.891429
Inverse of variance-covariance matrix:
1.061478 0.994883 0.817269 0.070054
0.994883 5.209577 5.336676 1.421289
0.817269 5.336676 7.660054 2.819468
0.070054 1.421289 2.819468 2.363995
T2 = 584.78
F = 73.10
In the remaining discussion in this section, we will consider multivariate tests
that are the m-dimensional equivalent of some of the tests we considered in Chap-
ter 2. However, we will not point out the details of the extrapolation from the
univariate to the general case as we have done with the T2 test. These derivations
can be found in many texts on multivariate statistics, some of which are listed in
the Selected Readings at the end of this chapter.
Equality of two vector means
The test we have just considered is a one-sample test against a specified population
mean vector. Suppose instead we have collected two independent random samples
and we wish to test the equivalency of their mean vectors. We assume that the two
samples are drawn from multivariate normal populations, both having the same
unknown variance-covariance matrix Z. We wish to test the null hypothesis
Ho : PI =Po
483