
Page 173 - Statistics and Data Analysis in Geology
P. 173
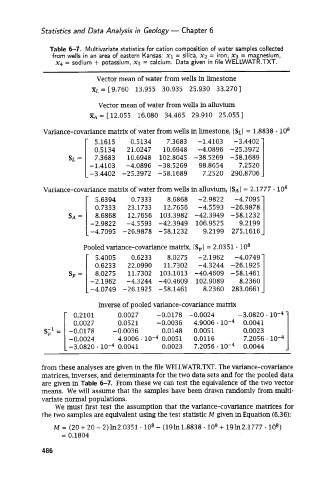
Statistics and Data Analysis in  Geology - Chapter 6


                Table 6-7.  Multivariate statistics  for cation composition  of water  samples collected
                 from wells in an area of eastern Kansas: x1  = silica, x2  = iron, XJ = magnesium,
                  x4  = sodium + potassium,  xg  = calcium.  Data given in file WELLWATR.TXT.

                              Vector mean of water from wells in limestone
                             XL = [ 9.760  13.955  30.935  25.930  33.2701

                               Vector mean of water from wells in alluvium
                            XA = [ 12.055  16.080  34.465  29.910  25.055 ]
                      SL= I            21.0247    10.6948    -1.4103   -3.4402
              Variance-covariance matrix of water from wells in limestone, ISL I = 1.8838 -  lo8

                                                   7.3683
                                        0.5134
                              5.1615
                                                             -4.0896  -25.3972
                             0.5134
                                       10.6948  102.8045  -38.5269
                              7.3683
                            -1.4103    -4.0896  -38.5269     98.8654   -58.1689  1
                                                                         7.2520
                            -3.4402   -25.3972  -58.1689      7.2520  290.8706
              Variance-covariance matrix of water from wells in alIuvium, IsAI = 2.1777 -  lo8
                           I           23.1733    12.7656    -4.5593  -26.9878  1
                              5.6394
                                                                        -4.7095
                                                   8.6868
                                        0.7333
                                                             -2.9822
                              0.7333
                                       12.7656  103.3982  -42.3949  -58.1232
                              8.6868
                      SA =   -2.9822   -4.5593  -42.3949    106.9525     9.2199
                            -4.7095  -26.9878  -58.1232
                                                              9.2199  275.1616
                          Pooled variance-covariance matrix, ISPI = 2.0351  lo8
                              5.4005    0.6233     8.0275    -2.1962    -4.0749
                              0.6233   22.0990    11.7302    -4.3244  -26.1925
                      Sp =    8.0275   11.7302  103.1013  -40.4609  -58.1461
                            -2.1962    -4.3244  -40.4609    102.9089     8.2360
                           I -4.0749  -26.1925  -58.1461      8.2360  283.0661
                               Inverse of pooled variance-covariance matrix
                       0.2101       0.0027      -0.0178   -0.0024        -3.0820  -
                       0.0027       0.0521      -0.0036    4.9006 .       0.0041
              s-1 =  -0.0178       -0.0036        0.0148   0.0051         0.0023
               P                                                          7.2056 .
                      -0.0024       4.9006. lom4 0.0051    0.0116
                      -3.0820  lo-*  0.0041       0.0023   7.2056 -       0.0044


              from these analyses are given in the file WELLWATR.TXT. The variance-covariance
              matrices, inverses, and determinants for the two data sets and for the pooled data
              are given in Table  6-7.  From these we  can test the equivalence of  the two vector
              means.  We  will assume that the samples have been drawn randomly from multi-
              variate normal populations.
                  We  must first test  the assumption that the variance-covariance matrices for
              the two samples are equivalent using the test statistic M  given in Equation (6.36):
                 M  = (20 + 20 - 2)1n2.0351. lo8 - (19ln1.8838. lo8 + 19h2.1777. lo8)
                    = 0.1804

              486