
Page 74 - Statistics and Data Analysis in Geology
P. 74
Statistics and Data Analysis in Geology - Chapter 3
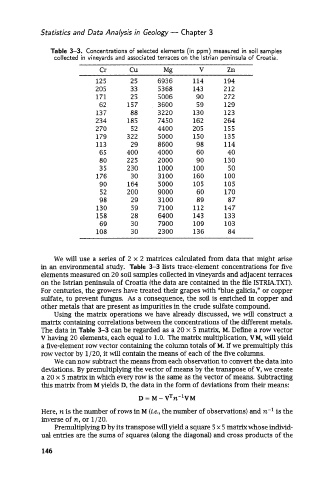
Table 3-3. Concentrations of selected elements (in ppm) measured in soil samples
collected in vineyards and associated terraces on the lstrian peninsula of Croatia.
Cr cu Mg V Zn
125 25 6936 114 194
205 33 5368 143 212
171 25 5006 90 2 72
62 157 3600 59 129
137 88 3220 130 123
2 34 185 7450 162 2 64
2 70 52 4400 205 155
179 322 5000 150 135
113 29 8600 98 114
65 400 4000 60 40
80 225 2000 90 130
35 230 1000 100 50
176 30 3100 160 100
90 164 5000 105 105
52 200 9000 60 170
98 29 3 100 89 87
130 59 7100 112 147
158 28 6400 143 133
69 30 7900 109 103
108 30 2300 136 84
We will use a series of 2 x 2 matrices calculated from data that might arise
in an environmental study. Table 3-3 lists trace-element concentrations for five
elements measured on 20 soil samples collected in vineyards and adjacent terraces
on the Istrian peninsula of Croatia (the data are contained in the file 1STRIA.TXT).
For centuries, the growers have treated their grapes with “blue galicia,” or copper
sulfate, to prevent fungus. As a consequence, the soil is enriched in copper and
other metals that are present as impurities in the crude sulfate compound.
Using the matrix operations we have already discussed, we will construct a
matrix containing correlations between the concentrations of the different metals.
The data in Table 3-3 can be regarded as a 20 x 5 matrix, M. Define a row vector
V having 20 elements, each equal to 1.0. The matrix multiplication, VM, will yield
a five-element row vector containing the column totals of M. If we premultiply this
row vector by 1 /20, it will contain the means of each of the five columns.
We can now subtract the means from each observation to convert the data into
deviations. By premultiplying the vector of means by the transpose of V, we create
a 20 x 5 matrix in which every row is the same as the vector of means. Subtracting
this matrix from M yields D, the data in the form of deviations from their means:
D = M - VTn-lVM
Here, n is the number of rows in M (te., the number of observations) and n-l is the
inverse of n, or 1/20.
Premultiplying D by its transpose will yield a square 5 x 5 matrix whose individ-
ual entries are the sums of squares (along the diagonal) and cross products of the
146