
Page 76 - Statistics and Data Analysis in Geology
P. 76
Statistics and Data Analysis in Geology - Chapter 3
-0.28, 1 I
-0.28,
1
1 .o: .o:
1
- -
-2.0-,, II ,,,,,,,,,I 4 IIIIIIIII I,,,, I
-2.0-,,
I,,,, I
I,,,,,,
I,,,,,, II ,,,,,,,,I,, 4 IIIIIIIII
3
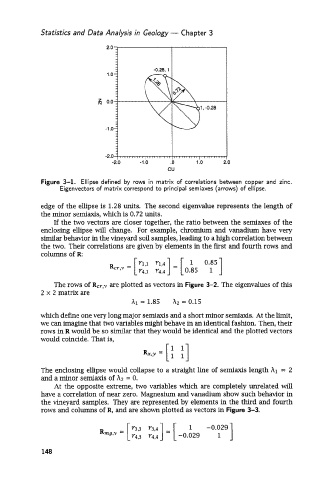
Figure 3-1. Ellipse defined by rows in matrix of correlations between copper and zinc.
Eigenvectors of matrix correspond to principal semiaxes (arrows) of ellipse.
edge of the ellipse is 1.28 units. The second eigenvalue represents the length of
the minor semiaxis, which is 0.72 units.
If the two vectors are closer together, the ratio between the semiaxes of the
enclosing ellipse will change. For example, chromium and vanadium have very
similar behavior in the vineyard soil samples, leading to a high correlation between
the two. Their correlations are given by elements in the first and fourth rows and
The rows of RCY,,, are plotted as vectors in Figure 3-2. The eigenvalues of this
2 x 2 matrix are
hi = 1.85 hz = 0.15
which define one very long major semiaxis and a short minor semiaxis. At the limit,
we can imagine that two variables might behave in an identical fashion. Then, their
rows in R would be so similar that they would be identical and the plotted vectors
would coincide. That is,
The enclosing ellipse would collapse to a straight line of semiaxis length hl = 2
and a minor semiaxis of hz = 0.
At the opposite extreme, two variables which are completely unrelated will
have a correlation of near zero. Magnesium and vanadium show such behavior in
the vineyard samples. They are represented by elements in the third and fourth
rows and columns of R, and are shown plotted as vectors in Figure 3-3.
148