
Page 301 - Statistics for Dummies
P. 301
Chapter 18: Looking for Links: Correlation and Regression
If the scatterplot doesn’t indicate there’s at least somewhat of a linear rela-
tionship, the correlation doesn’t mean much. Why measure the amount of
linear relationship if there isn’t enough of one to speak of? However you can
take the idea of no linear relationship two ways: 1) If no relationship at all
exists, calculating the correlation doesn’t make sense because correlation
only applies to linear relationships; and 2) If a strong relationship exists but
it’s not linear, the correlation may be misleading, because in some cases a
strong curved relationship exists yet the correlation turns out to be strong.
That’s why it’s critical to examine the scatterplot first.
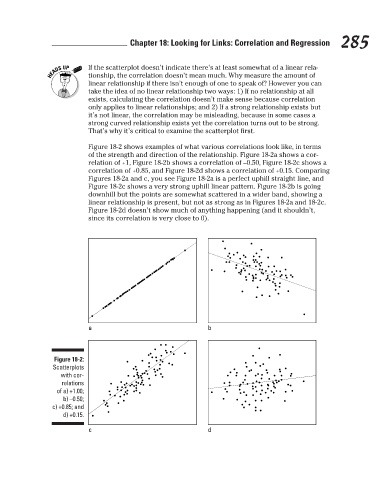
Figure 18-2 shows examples of what various correlations look like, in terms
of the strength and direction of the relationship. Figure 18-2a shows a cor-
relation of +1, Figure 18-2b shows a correlation of –0.50, Figure 18-2c shows a
correlation of +0.85, and Figure 18-2d shows a correlation of +0.15. Comparing
Figures 18-2a and c, you see Figure 18-2a is a perfect uphill straight line, and
Figure 18-2c shows a very strong uphill linear pattern. Figure 18-2b is going
downhill but the points are somewhat scattered in a wider band, showing a
linear relationship is present, but not as strong as in Figures 18-2a and 18-2c. 285
Figure 18-2d doesn’t show much of anything happening (and it shouldn’t,
since its correlation is very close to 0).
a b
Figure 18-2:
Scatterplots
with cor-
relations
of a) +1.00;
b) –0.50;
c) +0.85; and
d) +0.15.
c d
3/25/11 8:13 PM
26_9780470911082-ch18.indd 285 3/25/11 8:13 PM
26_9780470911082-ch18.indd 285