Page 312 - Statistics for Dummies
P. 312

296
                                         Part V: Statistical Studies and the Hunt for a Meaningful Relationship
                                         Organizing a Two-Way Table
                                                    To explore links between two categorical variables, you first need to organize
                                                    the data that’s been collected, and a table is a great way to do that. A two-way
                                                    table classifies individuals into groups based on the outcomes of two categor-
                                                    ical variables (for example, gender and opinion).
                                                    Suppose your local community developers are building a campground, and
                                                    they’ve decided pets will be allowed as long as they’re on a leash. They are
                                                    now trying to decide whether the campground should have a separate sec-
                                                    tion for pets. You have a hunch that non–pet campers in the area may be
                                                    more in favor of a separate pet area than pet campers, so you decide to find
                                                    out what the members of the camping community think. You randomly select
                                                    100 campers from the local area and conduct a pet camping survey, record-
                                                    ing each person’s opinion on having a pet section (yes, no) and if they camp
                                                    with pets (yes, no). You now have a spreadsheet with 100 rows of data, one
                                                    for each person you surveyed. Each row has two pieces of data: one column
                                                    for whether the person is a pet camper (yes, no) and one column for that
                                                    person’s opinion on having a pet section (support, oppose). Suppose the first
                                                    10 rows of your data set look like what’s shown in Table 19-1.
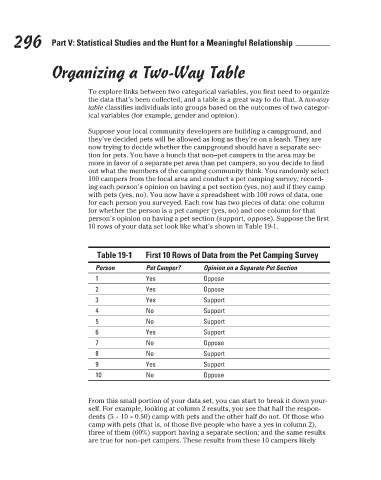
                                                      Table 19-1    First 10 Rows of Data from the Pet Camping Survey
                                                      Person        Pet Camper?     Opinion on a Separate Pet Section
                                                      1             Yes             Oppose
                                                      2             Yes             Oppose
                                                      3             Yes             Support
                                                      4             No              Support
                                                      5             No              Support
                                                      6             Yes             Support
                                                      7             No              Oppose
                                                      8             No              Support
                                                      9             Yes             Support
                                                      10            No              Oppose
                                                    From this small portion of your data set, you can start to break it down your-
                                                    self. For example, looking at column 2 results, you see that half the respon-
                                                    dents (5 ÷ 10 = 0.50) camp with pets and the other half do not. Of those who
                                                    camp with pets (that is, of those five people who have a yes in column 2),
                                                    three of them (60%) support having a separate section; and the same results
                                                    are true for non–pet campers. These results from these 10 campers likely


                                                                                                                           3/25/11   8:13 PM
                             27_9780470911082-ch19.indd   296                                                              3/25/11   8:13 PM
                             27_9780470911082-ch19.indd   296
   307   308   309   310   311   312   313   314   315   316   317