
Page 317 - Statistics for Dummies
P. 317
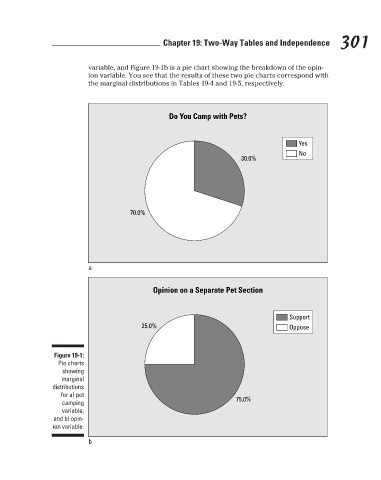
variable, and Figure 19-1b is a pie chart showing the breakdown of the opin-
                                                    ion variable. You see that the results of these two pie charts correspond with
                                                    the marginal distributions in Tables 19-4 and 19-5, respectively.
                                                                          Do You Camp with Pets?
                                                                                                              Yes
                                                                                                              No
                                                                                              30.0%
                                                               70.0%     Chapter 19: Two-Way Tables and Independence      301

                                                    a


                                                                      Opinion on a Separate Pet Section


                                                                                                            Support
                                                                   25.0%                                    Oppose


                                          Figure 19-1:
                                           Pie charts
                                            showing
                                            marginal
                                          distributions
                                            for a) pet
                                            camping                                          75.0%
                                            variable;
                                          and b) opin-
                                          ion variable.

                                                     b


                                                                                                                           3/25/11   8:13 PM
                             27_9780470911082-ch19.indd   301                                                              3/25/11   8:13 PM
                             27_9780470911082-ch19.indd   301