
Page 316 - Statistics for Dummies
P. 316
300
Part V: Statistical Studies and the Hunt for a Meaningful Relationship
To examine the results of a two-way table based on a single variable, you find
what statisticians call the marginal distribution for that variable. In the follow-
ing sections, I show you how to calculate and graph marginal distributions.
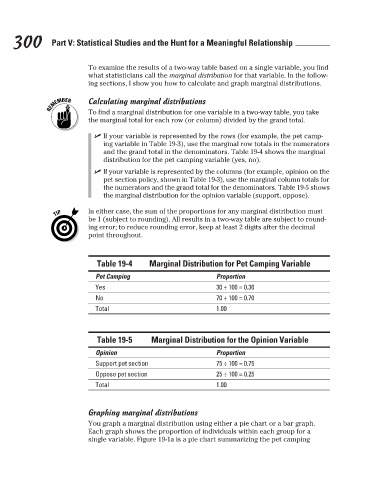
Calculating marginal distributions
the marginal total for each row (or column) divided by the grand total.
✓ If your variable is represented by the rows (for example, the pet camp-
ing variable in Table 19-3), use the marginal row totals in the numerators
and the grand total in the denominators. Table 19-4 shows the marginal
distribution for the pet camping variable (yes, no).
✓ If your variable is represented by the columns (for example, opinion on the
pet section policy, shown in Table 19-3), use the marginal column totals for
the numerators and the grand total for the denominators. Table 19-5 shows
the marginal distribution for the opinion variable (support, oppose).
In either case, the sum of the proportions for any marginal distribution must
To find a marginal distribution for one variable in a two-way table, you take
be 1 (subject to rounding). All results in a two-way table are subject to round-
ing error; to reduce rounding error, keep at least 2 digits after the decimal
point throughout.
Table 19-4 Marginal Distribution for Pet Camping Variable
Pet Camping Proportion
Yes 30 ÷ 100 = 0.30
No 70 ÷ 100 = 0.70
Total 1.00
Table 19-5 Marginal Distribution for the Opinion Variable
Opinion Proportion
Support pet section 75 ÷ 100 = 0.75
Oppose pet section 25 ÷ 100 = 0.25
Total 1.00
Graphing marginal distributions
You graph a marginal distribution using either a pie chart or a bar graph.
Each graph shows the proportion of individuals within each group for a
single variable. Figure 19-1a is a pie chart summarizing the pet camping
3/25/11 8:13 PM
27_9780470911082-ch19.indd 300
27_9780470911082-ch19.indd 300 3/25/11 8:13 PM