Page 320 - Statistics for Dummies
P. 320

304
                                         Part V: Statistical Studies and the Hunt for a Meaningful Relationship
                                                    Graphing joint distributions
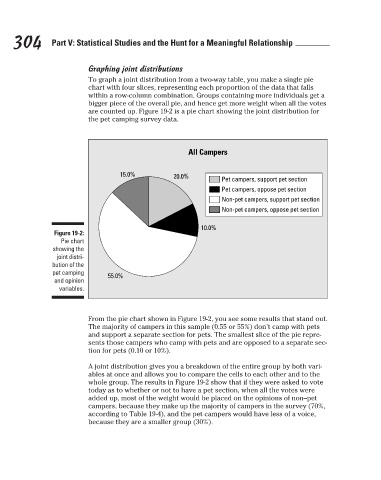
                                                    To graph a joint distribution from a two-way table, you make a single pie
                                                    chart with four slices, representing each proportion of the data that falls
                                                    within a row-column combination. Groups containing more individuals get a
                                                    bigger piece of the overall pie, and hence get more weight when all the votes
                                                    are counted up. Figure 19-2 is a pie chart showing the joint distribution for
                                                    the pet camping survey data.
                                                                                All Campers
                                                             15.0%
                                                                           20.0%
                                                                                         Pet campers, support pet section
                                                                                         Pet campers, oppose pet section
                                                                                         Non-pet campers, support pet section
                                                                                         Non-pet campers, oppose pet section
                                                                                   10.0%
                                          Figure 19-2:
                                            Pie chart
                                          showing the
                                           joint distri-
                                          bution of the
                                          pet camping
                                                         55.0%
                                          and opinion
                                            variables.

                                                    From the pie chart shown in Figure 19-2, you see some results that stand out.
                                                    The majority of campers in this sample (0.55 or 55%) don’t camp with pets
                                                    and support a separate section for pets. The smallest slice of the pie repre-
                                                    sents those campers who camp with pets and are opposed to a separate sec-
                                                    tion for pets (0.10 or 10%).
                                                    A joint distribution gives you a breakdown of the entire group by both vari-
                                                    ables at once and allows you to compare the cells to each other and to the
                                                    whole group. The results in Figure 19-2 show that if they were asked to vote
                                                    today as to whether or not to have a pet section, when all the votes were
                                                    added up, most of the weight would be placed on the opinions of non–pet
                                                    campers, because they make up the majority of campers in the survey (70%,
                                                    according to Table 19-4), and the pet campers would have less of a voice,
                                                    because they are a smaller group (30%).


                                                                                                                           3/25/11   8:13 PM
                             27_9780470911082-ch19.indd   304                                                              3/25/11   8:13 PM
                             27_9780470911082-ch19.indd   304
   315   316   317   318   319   320   321   322   323   324   325