Page 325 - Statistics for Dummies
P. 325

Chapter 19: Two-Way Tables and Independence
                                                    Comparing the results of two conditional distributions
                                                   Two categorical variables are independent if the conditional distributions
                                                    are the same for all groups being compared. The variables are independent
                                                    because breaking them down and comparing them by group doesn’t change
                                                    the results. In the election example I introduced at the beginning of “Checking
                                                    Independence and Describing Dependence,” independence means the condi-
                                                    tional distribution for opinion is the same for the males and the females.
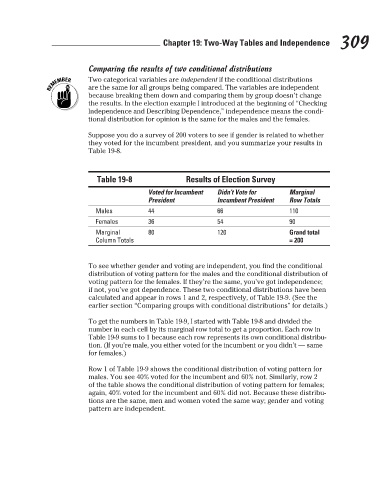
                                                    Suppose you do a survey of 200 voters to see if gender is related to whether
                                                    they voted for the incumbent president, and you summarize your results in
                                                    Table 19-8.
                                                                               Results of Election Survey
                                                      Table 19-8
                                                                    President
                                                                                                            Row Totals
                                                                                        Incumbent President
                                                                                        66
                                                      Males         Voted for Incumbent   Didn’t Vote for   Marginal      309
                                                                                                            110
                                                                    44
                                                      Females       36                  54                  90
                                                      Marginal      80                  120                 Grand total
                                                      Column Totals                                         = 200
                                                    To see whether gender and voting are independent, you find the conditional
                                                    distribution of voting pattern for the males and the conditional distribution of
                                                    voting pattern for the females. If they’re the same, you’ve got independence;
                                                    if not, you’ve got dependence. These two conditional distributions have been
                                                    calculated and appear in rows 1 and 2, respectively, of Table 19-9. (See the
                                                    earlier section “Comparing groups with conditional distributions” for details.)
                                                    To get the numbers in Table 19-9, I started with Table 19-8 and divided the
                                                    number in each cell by its marginal row total to get a proportion. Each row in
                                                    Table 19-9 sums to 1 because each row represents its own conditional distribu-
                                                    tion. (If you’re male, you either voted for the incumbent or you didn’t — same
                                                    for females.)
                                                    Row 1 of Table 19-9 shows the conditional distribution of voting pattern for
                                                    males. You see 40% voted for the incumbent and 60% not. Similarly, row 2
                                                    of the table shows the conditional distribution of voting pattern for females;
                                                    again, 40% voted for the incumbent and 60% did not. Because these distribu-
                                                    tions are the same, men and women voted the same way; gender and voting
                                                    pattern are independent.


                                                                                                                           3/25/11   8:13 PM
                             27_9780470911082-ch19.indd   309                                                              3/25/11   8:13 PM
                             27_9780470911082-ch19.indd   309
   320   321   322   323   324   325   326   327   328   329   330