
Page 326 - Statistics for Dummies
P. 326
310
Part V: Statistical Studies and the Hunt for a Meaningful Relationship
Table 19-9
Results of Election Survey with
Conditional Distributions
President
President
Males
66 ÷ 110 = 0.60
1.00
44 ÷ 110 = 0.40
54 ÷ 90 = 0.60
1.00
36 ÷ 90 = 0.40
Females
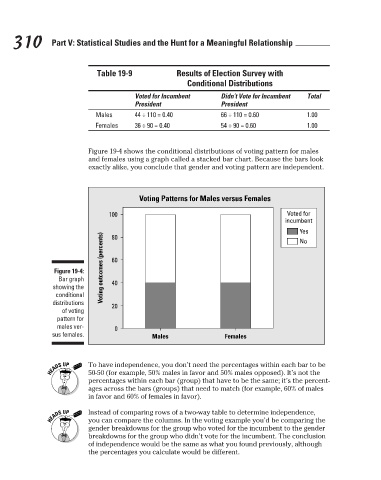
Figure 19-4 shows the conditional distributions of voting pattern for males
and females using a graph called a stacked bar chart. Because the bars look
exactly alike, you conclude that gender and voting pattern are independent.
Voting Patterns for Males versus Females
Voted for
100 Voted for Incumbent Didn’t Vote for Incumbent Total
incumbent
Yes
Voting outcomes (percents) 60
80
No
Figure 19-4:
Bar graph
showing the 40
conditional
distributions 20
of voting
pattern for
males ver- 0
sus females. Males Females
To have independence, you don’t need the percentages within each bar to be
50-50 (for example, 50% males in favor and 50% males opposed). It’s not the
percentages within each bar (group) that have to be the same; it’s the percent-
ages across the bars (groups) that need to match (for example, 60% of males
in favor and 60% of females in favor).
Instead of comparing rows of a two-way table to determine independence,
you can compare the columns. In the voting example you’d be comparing the
gender breakdowns for the group who voted for the incumbent to the gender
breakdowns for the group who didn’t vote for the incumbent. The conclusion
of independence would be the same as what you found previously, although
the percentages you calculate would be different.
3/25/11 8:13 PM
27_9780470911082-ch19.indd 310 3/25/11 8:13 PM
27_9780470911082-ch19.indd 310