
Page 323 - Statistics for Dummies
P. 323
Chapter 19: Two-Way Tables and Independence
Support
21%
33%
80
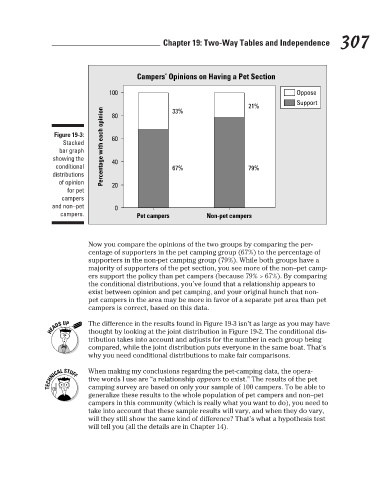
Figure 19-3:
60
Stacked
bar graph
showing the
40
conditional
67%
79%
distributions
of opinion
20
for pet
campers
and non–pet Percentage with each opinion 100 0 Campers’ Opinions on Having a Pet Section Oppose 307
campers. Pet campers Non-pet campers
Now you compare the opinions of the two groups by comparing the per-
centage of supporters in the pet camping group (67%) to the percentage of
supporters in the non-pet camping group (79%). While both groups have a
majority of supporters of the pet section, you see more of the non–pet camp-
ers support the policy than pet campers (because 79% > 67%). By comparing
the conditional distributions, you’ve found that a relationship appears to
exist between opinion and pet camping, and your original hunch that non-
pet campers in the area may be more in favor of a separate pet area than pet
campers is correct, based on this data.
The difference in the results found in Figure 19-3 isn’t as large as you may have
thought by looking at the joint distribution in Figure 19-2. The conditional dis-
tribution takes into account and adjusts for the number in each group being
compared, while the joint distribution puts everyone in the same boat. That’s
why you need conditional distributions to make fair comparisons.
When making my conclusions regarding the pet-camping data, the opera-
tive words I use are “a relationship appears to exist.” The results of the pet
camping survey are based on only your sample of 100 campers. To be able to
generalize these results to the whole population of pet campers and non–pet
campers in this community (which is really what you want to do), you need to
take into account that these sample results will vary, and when they do vary,
will they still show the same kind of difference? That’s what a hypothesis test
will tell you (all the details are in Chapter 14).
3/25/11 8:13 PM
27_9780470911082-ch19.indd 307 3/25/11 8:13 PM
27_9780470911082-ch19.indd 307