Page 322 - Statistics for Dummies
P. 322

306
                                         Part V: Statistical Studies and the Hunt for a Meaningful Relationship
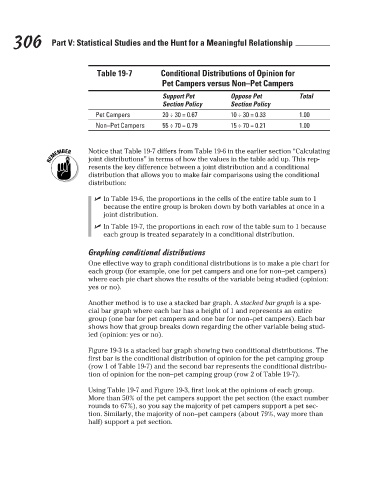
                                                      Table 19-7
                                                                        Conditional Distributions of Opinion for

                                                                        Pet Campers versus Non–Pet Campers
                                                                        Support Pet
                                                                                           Oppose Pet
                                                                                                              Total
                                                                        Section Policy
                                                                                           Section Policy
                                                      Pet Campers
                                                                                           10 ÷ 30 = 0.33
                                                                        20 ÷ 30 = 0.67
                                                                                                              1.00
                                                                        55 ÷ 70 = 0.79
                                                                                                              1.00
                                                      Non–Pet Campers
                                                                                           15 ÷ 70 = 0.21
                                                   Notice that Table 19-7 differs from Table 19-6 in the earlier section “Calculating
                                                    joint distributions” in terms of how the values in the table add up. This rep-
                                                    resents the key difference between a joint distribution and a conditional
                                                    distribution that allows you to make fair comparisons using the conditional
                                                    distribution:
                                                     ✓ In Table 19-6, the proportions in the cells of the entire table sum to 1
                                                        because the entire group is broken down by both variables at once in a
                                                        joint distribution.
                                                     ✓ In Table 19-7, the proportions in each row of the table sum to 1 because
                                                        each group is treated separately in a conditional distribution.
                                                    Graphing conditional distributions
                                                    One effective way to graph conditional distributions is to make a pie chart for
                                                    each group (for example, one for pet campers and one for non–pet campers)
                                                    where each pie chart shows the results of the variable being studied (opinion:
                                                    yes or no).
                                                    Another method is to use a stacked bar graph. A stacked bar graph is a spe-
                                                    cial bar graph where each bar has a height of 1 and represents an entire
                                                    group (one bar for pet campers and one bar for non–pet campers). Each bar
                                                    shows how that group breaks down regarding the other variable being stud-
                                                    ied (opinion: yes or no).
                                                    Figure 19-3 is a stacked bar graph showing two conditional distributions. The
                                                    first bar is the conditional distribution of opinion for the pet camping group
                                                    (row 1 of Table 19-7) and the second bar represents the conditional distribu-
                                                    tion of opinion for the non–pet camping group (row 2 of Table 19-7).
                                                    Using Table 19-7 and Figure 19-3, first look at the opinions of each group.
                                                    More than 50% of the pet campers support the pet section (the exact number
                                                    rounds to 67%), so you say the majority of pet campers support a pet sec-
                                                    tion. Similarly, the majority of non–pet campers (about 79%, way more than
                                                    half) support a pet section.

                                                                                                                           3/25/11   8:13 PM
                             27_9780470911082-ch19.indd   306                                                              3/25/11   8:13 PM
                             27_9780470911082-ch19.indd   306
   317   318   319   320   321   322   323   324   325   326   327