
Page 105 - Statistics for Environmental Engineers
P. 105
L1592_Frame_C11 Page 100 Tuesday, December 18, 2001 1:47 PM
14
12
X X 10
8
6
4
R 2
0
0 10 20 30 40 50 60
Duplicate Pair
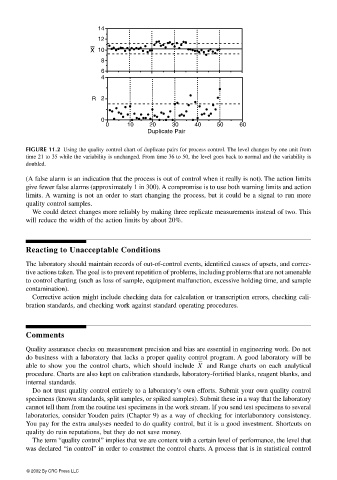
FIGURE 11.2 Using the quality control chart of duplicate pairs for process control. The level changes by one unit from
time 21 to 35 while the variability is unchanged. From time 36 to 50, the level goes back to normal and the variability is
doubled.
(A false alarm is an indication that the process is out of control when it really is not). The action limits
give fewer false alarms (approximately 1 in 300). A compromise is to use both warning limits and action
limits. A warning is not an order to start changing the process, but it could be a signal to run more
quality control samples.
We could detect changes more reliably by making three replicate measurements instead of two. This
will reduce the width of the action limits by about 20%.
Reacting to Unacceptable Conditions
The laboratory should maintain records of out-of-control events, identified causes of upsets, and correc-
tive actions taken. The goal is to prevent repetition of problems, including problems that are not amenable
to control charting (such as loss of sample, equipment malfunction, excessive holding time, and sample
contamination).
Corrective action might include checking data for calculation or transcription errors, checking cali-
bration standards, and checking work against standard operating procedures.
Comments
Quality assurance checks on measurement precision and bias are essential in engineering work. Do not
do business with a laboratory that lacks a proper quality control program. A good laboratory will be
able to show you the control charts, which should include X and Range charts on each analytical
procedure. Charts are also kept on calibration standards, laboratory-fortified blanks, reagent blanks, and
internal standards.
Do not trust quality control entirely to a laboratory’s own efforts. Submit your own quality control
specimens (known standards, split samples, or spiked samples). Submit these in a way that the laboratory
cannot tell them from the routine test specimens in the work stream. If you send test specimens to several
laboratories, consider Youden pairs (Chapter 9) as a way of checking for interlaboratory consistency.
You pay for the extra analyses needed to do quality control, but it is a good investment. Shortcuts on
quality do ruin reputations, but they do not save money.
The term “quality control” implies that we are content with a certain level of performance, the level that
was declared “in control” in order to construct the control charts. A process that is in statistical control
© 2002 By CRC Press LLC