
Page 103 - Statistics for Environmental Engineers
P. 103
L1592_Frame_C11 Page 98 Tuesday, December 18, 2001 1:47 PM
TABLE 11.1
Fifteen Pairs of Measurements on Duplicate Test Specimens
Specimen 1 2 3 4 5 6 7 8 9 10 11 12 13 14 15
5.2 3.1 2.5 3.8 4.3 3.1 4.5 3.8 4.3 5.3 3.6 5.0 3.0 4.7 3.7
X 1
4.4 4.6 5.3 3.7 4.4 3.3 3.8 3.2 4.5 3.7 4.4 4.8 3.6 3.5 5.2
X 2
X = X 1 + X 2 4.8 3.8 3.9 3.8 4.3 3.2 4.2 3.5 4.4 4.5 4.0 4.9 3.3 4.1 4.4
-----------------
2
R = |X 1 – X 2 | 0.8 1.5 2.8 0.1 0.1 0.2 0.7 0.6 0.2 1.6 0.8 0.2 0.6 1.2 1.5
Grand mean = X = 4.08, Mean sample range = R = 0.86
6
X1
& 4
X2
2
6
UCL
5
=
Ave. 4 X
3
LCL
2
4
3 UCL
R 2
1
0
0 5 10 15
Observation
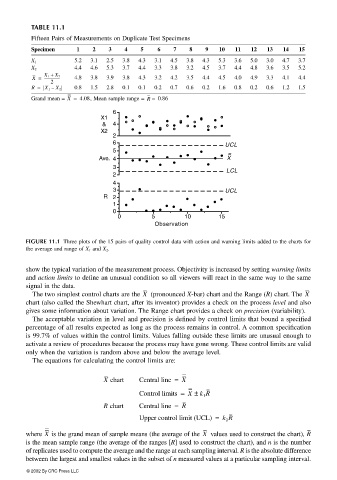
FIGURE 11.1 Three plots of the 15 pairs of quality control data with action and warning limits added to the charts for
the average and range of X 1 and X 2 .
show the typical variation of the measurement process. Objectivity is increased by setting warning limits
and action limits to define an unusual condition so all viewers will react in the same way to the same
signal in the data.
The two simplest control charts are the X (pronounced X-bar) chart and the Range (R) chart. The X
chart (also called the Shewhart chart, after its inventor) provides a check on the process level and also
gives some information about variation. The Range chart provides a check on precision (variability).
The acceptable variation in level and precision is defined by control limits that bound a specified
percentage of all results expected as long as the process remains in control. A common specification
is 99.7% of values within the control limits. Values falling outside these limits are unusual enough to
activate a review of procedures because the process may have gone wrong. These control limits are valid
only when the variation is random above and below the average level.
The equations for calculating the control limits are:
X chart Central line = X
Control limits = X ± k 1 R
R chart Central line = R
Upper control limit (UCL) = k 2 R
X
where is the grand mean of sample means (the average of the X values used to construct the chart), R
is the mean sample range (the average of the ranges [R] used to construct the chart), and n is the number
of replicates used to compute the average and the range at each sampling interval. R is the absolute difference
between the largest and smallest values in the subset of n measured values at a particular sampling interval.
© 2002 By CRC Press LLC