
Page 112 - Statistics for Environmental Engineers
P. 112
L1592_frame_C12.fm Page 108 Tuesday, December 18, 2001 1:48 PM
The weight λ is a value less than 1.0, and often in the range 0.1 to 0.5. The weights decay exponentially
from the current observation into the past. The current observation has weight 1 − λ, the previous has
2
weight (1 – λ)λ, the observation before that (1 – λ)λ , and so on. The value of λ determines the weight
placed on the observations in the EWMA. A small value of λ gives a large weight to the current
observation and the average does not remember very far into the past. A large value of λ gives a weighted
average with a long memory. In practice, a weighted average with a long memory is dominated by the
most recent four to six observations.
Comparison of the Charts
Shewhart, Cusum, Moving Average, and EWMA charts (Figures 12.1 to 12.3) differ in the way they
weight previous observations. The Shewhart chart gives all weight to the current observation and no
weight to all previous observations. The Cusum chart gives equal weight to all observations. The moving
average chart gives equal weight to the k most recent observations and zero weight to all other obser-
vations. The EWMA chart gives the most weight to the most recent observation and progressively smaller
weights to previous observations.
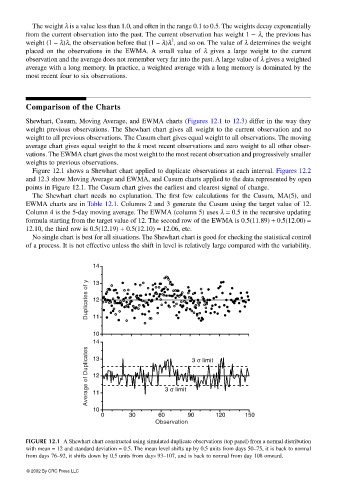
Figure 12.1 shows a Shewhart chart applied to duplicate observations at each interval. Figures 12.2
and 12.3 show Moving Average and EWMA, and Cusum charts applied to the data represented by open
points in Figure 12.1. The Cusum chart gives the earliest and clearest signal of change.
The Shewhart chart needs no explanation. The first few calculations for the Cusum, MA(5), and
EWMA charts are in Table 12.1. Columns 2 and 3 generate the Cusum using the target value of 12.
Column 4 is the 5-day moving average. The EWMA (column 5) uses λ = 0.5 in the recursive updating
formula starting from the target value of 12. The second row of the EWMA is 0.5(11.89) + 0.5(12.00) =
12.10, the third row is 0.5(12.19) + 0.5(12.10) = 12.06, etc.
No single chart is best for all situations. The Shewhart chart is good for checking the statistical control
of a process. It is not effective unless the shift in level is relatively large compared with the variability.
14
Duplicates of y 12
13
11
10
14
Average of Duplicates 12 3 σ limit 3 σ limit
13
11
10
0 30 60 90 120 150
Observation
FIGURE 12.1 A Shewhart chart constructed using simulated duplicate observations (top panel) from a normal distribution
with mean = 12 and standard deviation = 0.5. The mean level shifts up by 0.5 units from days 50–75, it is back to normal
from days 76–92, it shifts down by 0.5 units from days 93–107, and is back to normal from day 108 onward.
© 2002 By CRC Press LLC