
Page 114 - Statistics for Environmental Engineers
P. 114
L1592_frame_C12.fm Page 110 Tuesday, December 18, 2001 1:48 PM
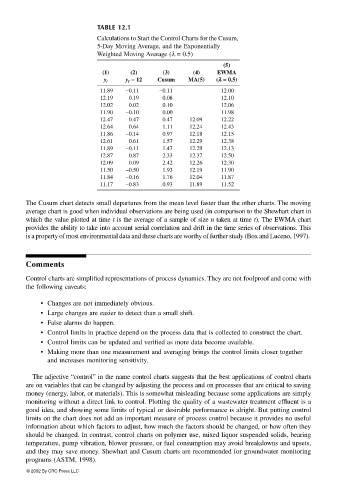
TABLE 12.1
Calculations to Start the Control Charts for the Cusum,
5-Day Moving Average, and the Exponentially
Weighted Moving Average (λ = 0.5)
(5)
(1) (2) (3) (4) EWMA
y I −− −− 12 Cusum MA(5) (λλ λλ == == 0.5)
y i
11.89 −0.11 −0.11 12.00
12.19 0.19 0.08 12.10
12.02 0.02 0.10 12.06
11.90 −0.10 0.00 11.98
12.47 0.47 0.47 12.09 12.22
12.64 0.64 1.11 12.24 12.43
11.86 −0.14 0.97 12.18 12.15
12.61 0.61 1.57 12.29 12.38
11.89 −0.11 1.47 12.29 12.13
12.87 0.87 2.33 12.37 12.50
12.09 0.09 2.42 12.26 12.30
11.50 −0.50 1.93 12.19 11.90
11.84 −0.16 1.76 12.04 11.87
11.17 −0.83 0.93 11.89 11.52
The Cusum chart detects small departures from the mean level faster than the other charts. The moving
average chart is good when individual observations are being used (in comparison to the Shewhart chart in
which the value plotted at time t is the average of a sample of size n taken at time t). The EWMA chart
provides the ability to take into account serial correlation and drift in the time series of observations. This
is a property of most environmental data and these charts are worthy of further study (Box and Luceno, 1997).
Comments
Control charts are simplified representations of process dynamics. They are not foolproof and come with
the following caveats:
• Changes are not immediately obvious.
• Large changes are easier to detect than a small shift.
• False alarms do happen.
• Control limits in practice depend on the process data that is collected to construct the chart.
• Control limits can be updated and verified as more data become available.
• Making more than one measurement and averaging brings the control limits closer together
and increases monitoring sensitivity.
The adjective “control” in the name control charts suggests that the best applications of control charts
are on variables that can be changed by adjusting the process and on processes that are critical to saving
money (energy, labor, or materials). This is somewhat misleading because some applications are simply
monitoring without a direct link to control. Plotting the quality of a wastewater treatment effluent is a
good idea, and showing some limits of typical or desirable performance is alright. But putting control
limits on the chart does not add an important measure of process control because it provides no useful
information about which factors to adjust, how much the factors should be changed, or how often they
should be changed. In contrast, control charts on polymer use, mixed liquor suspended solids, bearing
temperature, pump vibration, blower pressure, or fuel consumption may avoid breakdowns and upsets,
and they may save money. Shewhart and Cusum charts are recommended for groundwater monitoring
programs (ASTM, 1998).
© 2002 By CRC Press LLC