
Page 119 - Statistics for Environmental Engineers
P. 119
L1592_Frame_C13.fm Page 115 Tuesday, December 18, 2001 1:49 PM
Detecting a Change in a Rate of Increase
Suppose that the normal rate of change in a process gives a straight line y t = βt + a t with slope β and
you want to monitor for the possibility that this rate has changed. The deviation from the line representing
normal wear is a t = y t − βt and the appropriate Cuscore is Q = ∑(y t − βt)t.
Detecting a Sine Wave Buried in Noise
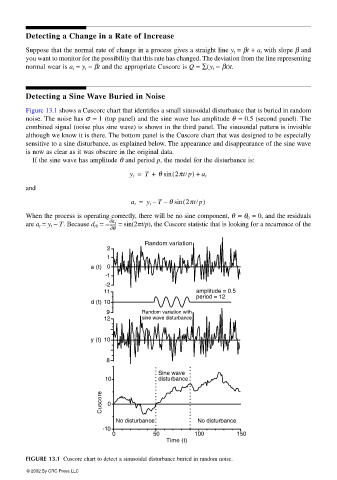
Figure 13.1 shows a Cuscore chart that identifies a small sinusoidal disturbance that is buried in random
noise. The noise has σ = 1 (top panel) and the sine wave has amplitude θ = 0.5 (second panel). The
combined signal (noise plus sine wave) is shown in the third panel. The sinusoidal pattern is invisible
although we know it is there. The bottom panel is the Cuscore chart that was designed to be especially
sensitive to a sine disturbance, as explained below. The appearance and disappearance of the sine wave
is now as clear as it was obscure in the original data.
If the sine wave has amplitude θ and period p, the model for the disturbance is:
y t = T + θ sin ( 2πt/p) + a t
and
a t = y t – T – θ sin ( 2πt/p)
When the process is operating correctly, there will be no sine component, θ = θ 0 = 0, and the residuals
a ∂
are a t = y t − T. Because d t0 = −----- t = sin(2πt/p), the Cuscore statistic that is looking for a recurrence of the
θ ∂
Random variation
2
1
a (t) 0
-1
-2
11 amplitude = 0.5
period = 12
d (t) 10
9 Random variation with
12 sine wave disturbance
y (t) 10
8
Sine wave
10 disturbance
Cuscore 0
No disturbance No disturbance
-10
0 50 100 150
Time (t)
FIGURE 13.1 Cuscore chart to detect a sinusoidal disturbance buried in random noise.
© 2002 By CRC Press LLC