
Page 124 - Statistics for Environmental Engineers
P. 124
L1592_frame_C14 Page 120 Tuesday, December 18, 2001 1:49 PM
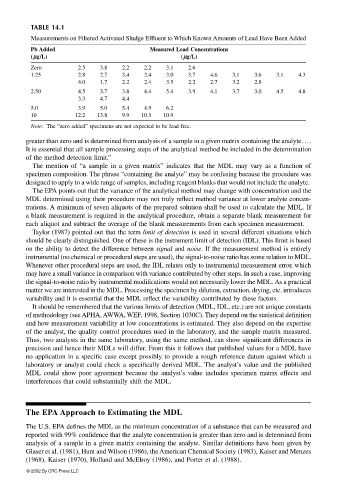
TABLE 14.1
Measurements on Filtered Activated Sludge Effluent to Which Known Amounts of Lead Have Been Added
Pb Added Measured Lead Concentrations
(µµ µµg/L) (µµ µµg/L)
Zero 2.5 3.8 2.2 2.2 3.1 2.6
1.25 2.8 2.7 3.4 2.4 3.0 3.7 4.6 3.1 3.6 3.1 4.3
4.0 1.7 2.2 2.4 3.5 2.2 2.7 3.2 2.8
2.50 4.5 3.7 3.8 4.4 5.4 3.9 4.1 3.7 3.0 4.5 4.8
3.3 4.7 4.4
5.0 3.9 5.0 5.4 4.9 6.2
10 12.2 13.8 9.9 10.5 10.9
Note: The “zero added” specimens are not expected to be lead-free.
greater than zero and is determined from analysis of a sample in a given matrix containing the analyte….
It is essential that all sample processing steps of the analytical method be included in the determination
of the method detection limit.”
The mention of “a sample in a given matrix” indicates that the MDL may vary as a function of
specimen composition. The phrase “containing the analyte” may be confusing because the procedure was
designed to apply to a wide range of samples, including reagent blanks that would not include the analyte.
The EPA points out that the variance of the analytical method may change with concentration and the
MDL determined using their procedure may not truly reflect method variance at lower analyte concen-
trations. A minimum of seven aliquots of the prepared solution shall be used to calculate the MDL. If
a blank measurement is required in the analytical procedure, obtain a separate blank measurement for
each aliquot and subtract the average of the blank measurements from each specimen measurement.
Taylor (1987) pointed out that the term limit of detection is used in several different situations which
should be clearly distinguished. One of these is the instrument limit of detection (IDL). This limit is based
on the ability to detect the difference between signal and noise. If the measurement method is entirely
instrumental (no chemical or procedural steps are used), the signal-to-noise ratio has some relation to MDL.
Whenever other procedural steps are used, the IDL relates only to instrumental measurement error, which
may have a small variance in comparison with variance contributed by other steps. In such a case, improving
the signal-to-noise ratio by instrumental modifications would not necessarily lower the MDL. As a practical
matter we are interested in the MDL. Processing the specimen by dilution, extraction, drying, etc. introduces
variability and it is essential that the MDL reflect the variability contributed by these factors.
It should be remembered that the various limits of detection (MDL, IDL, etc.) are not unique constants
of methodology (see APHA, AWWA, WEF, 1998, Section 1030C). They depend on the statistical definition
and how measurement variability at low concentrations is estimated. They also depend on the expertise
of the analyst, the quality control procedures used in the laboratory, and the sample matrix measured.
Thus, two analysts in the same laboratory, using the same method, can show significant differences in
precision and hence their MDLs will differ. From this it follows that published values for a MDL have
no application in a specific case except possibly to provide a rough reference datum against which a
laboratory or analyst could check a specifically derived MDL. The analyst’s value and the published
MDL could show poor agreement because the analyst’s value includes specimen matrix effects and
interferences that could substantially shift the MDL.
The EPA Approach to Estimating the MDL
The U.S. EPA defines the MDL as the minimum concentration of a substance that can be measured and
reported with 99% confidence that the analyte concentration is greater than zero and is determined from
analysis of a sample in a given matrix containing the analyte. Similar definitions have been given by
Glaser et al. (1981), Hunt and Wilson (1986), the American Chemical Society (1983), Kaiser and Menzes
(1968), Kaiser (1970), Holland and McElroy (1986), and Porter et al. (1988).
© 2002 By CRC Press LLC