Page 126 - Statistics for Environmental Engineers
P. 126

L1592_frame_C14  Page 122  Tuesday, December 18, 2001  1:49 PM
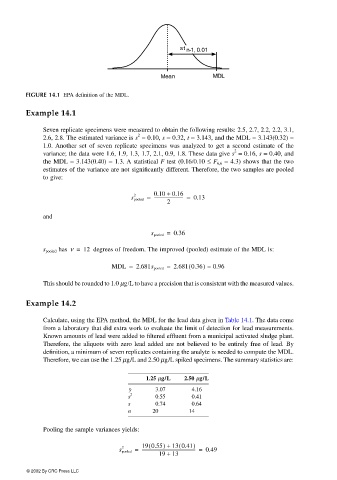


                                                                 st  n-1, 0.01


                                                            Mean           MDL

                       FIGURE 14.1  EPA definition of the MDL.

                       Example 14.1

                           Seven replicate specimens were measured to obtain the following results: 2.5, 2.7, 2.2, 2.2, 3.1,
                                                      2
                           2.6, 2.8. The estimated variance is s  = 0.10, s = 0.32, t = 3.143, and the MDL = 3.143(0.32) =
                           1.0. Another set of seven replicate specimens  was analyzed to get a second estimate of the
                                                                                 2
                           variance; the data were 1.6, 1.9, 1.3, 1.7, 2.1, 0.9, 1.8. These data give s  = 0.16, s = 0.40, and
                           the MDL = 3.143(0.40) = 1.3. A statistical F test (0.16/0.10 ≤ F 6,6  = 4.3) shows that the two
                           estimates of the variance are not significantly different. Therefore, the two samples are pooled
                           to give:

                                                          0.10 +  0.16
                                                    s pooled =  --------------------------- =  0.13
                                                     2
                                                              2
                           and

                                                         s pooled =  0.36

                           s pooled  has ν =  12   degrees of freedom. The improved (pooled) estimate of the MDL is:
                                              MDL =  2.681s pooled =  2.681 0.36) =  0.96
                                                                    (

                           This should be rounded to 1.0 µg /L to have a precision that is consistent with the measured values.

                       Example 14.2

                           Calculate, using the EPA method, the MDL for the lead data given in Table 14.1. The data come
                           from a laboratory that did extra work to evaluate the limit of detection for lead measurements.
                           Known amounts of lead were added to filtered effluent from a municipal activated sludge plant.
                           Therefore, the aliquots with zero lead added are not believed to be entirely free of lead. By
                           definition, a minimum of seven replicates containing the analyte is needed to compute the MDL.
                           Therefore, we can use the 1.25 µg/L and 2.50 µg/L spiked specimens. The summary statistics are:

                                                        1.25 µg/L  2.50 µg/L
                                                   y       3.07      4.16
                                                   s 2     0.55      0.41
                                                   s       0.74      0.64
                                                   n      20        14

                           Pooling the sample variances yields:

                                                                 (
                                                       19 0.55) +  13 0.41)
                                                         (
                                                 s pooled =  ------------------------------------------------- =  0.49
                                                 2
                                                            19 +  13
                       © 2002 By CRC Press LLC
   121   122   123   124   125   126   127   128   129   130   131