
Page 125 - Statistics for Environmental Engineers
P. 125
L1592_frame_C14 Page 121 Tuesday, December 18, 2001 1:49 PM
Measurements are made on a minimum of seven aliquots (n ≥ 7) of a prepared solution that has a
concentration near the expected limit of detection. These data are used to calculate the variance of the
replicate measurements:
n
1
s = ------------ ∑ ( y i – y) 2
2
–
n 1
i=1
where y i (i = 1 to n) are the measured values. The MDL is:
MDL = s × t ν,α=0.01
is the Student’s t value appropriate for a 99% confidence level and a standard deviation
where t ν,α=0.01
estimate α with ν = n − 1 degrees of freedom. This is the t value that cuts off the upper 1% of the t
distribution. For n = 7 and ν = 6, t 6,0.01 = 3.143 and the estimated MDL = 3.143s.
The EPA points out that the variance of the analytical method may change with concentration. If this
happens, the estimated MDL will also vary, depending on the concentration of the prepared solution on
which the replicate measurements were made. The EPA suggests that the analyst check this by analyzing
seven replicate aliquots at a slightly different concentration to “verify the reasonableness” of the estimate
of the MDL. If variances at different concentrations are judged to be the same (based on the F statistic
2
of their ratio), the variances are combined (pooled) to obtain a single estimate for s . The general relation
for k pooled variances is:
( n 1 – 1)s 1 + ( n 2 – 1)s 2 + … + ( n k – 2
2
2
s pooled = -----------------------------------------------------------------------------------------------
1)s k
2
( n 1 – 1) + ( n 2 – 1) + … + ( n k – 1)
2 has ν = 1) + 1) + … +
s pooled (n 1 – (n 2 – (n k – 1) degrees of freedom. When the variances have identical
2 2
degrees of freedom, pooling is just averaging the variances. In the case of two variances, s 1 and s 2 ,
each determined from seven replicate measurements, the pooled variance is:
6s 1 + 2 s 1 + 2
2
2
s pooled = --------------------- = --------------
s 2
2
6s 2
6 + 6 2
2
The 6’s are the degrees of freedom for the two sets of seven aliquot observations. s pooled and s pooled have
12 degrees of freedom, giving t 12,0.01 = 2.681 and MDL = 2.681s pooled . If more than seven aliquots were
used, the appropriate Student’s t value for α = 0.01 would be taken from Table 14.2.
The EPA definition of the MDL is illustrated by Figure 14.1. Measurements on test specimens are
pictured as being normally distributed about the true concentration. A small probability (100α%) exists
that a measurement on a true blank will exceed the MDL, which is located a distance st ν,α to the right
of the mean concentration. If the test specimens were true blanks (concentration equal zero), this definition
of the MDL provides a 100(1 − α)% degree of protection against declaring that the analyte was detected
in a specimen in which it was truly absent.
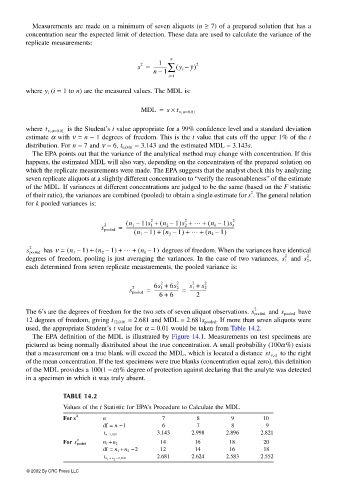
TABLE 14.2
Values of the t Statistic for EPA’s Procedure to Calculate the MDL
For s 2 n 7 8 9 10
df = n − 1 6 7 8 9
3.143 2.998 2.896 2.821
t n−1,0.01
2
For s pooled n 1 + n 2 14 16 18 20
df = n 1 + n 2 − 2 12 14 16 18
2.681 2.624 2.583 2.552
t n 1 + n 2 – 2, 0.01
© 2002 By CRC Press LLC