
Page 131 - Statistics for Environmental Engineers
P. 131
L1592_frame_C14 Page 127 Tuesday, December 18, 2001 1:49 PM
Taylor, J. K. (1987). Quality Assurance of Chemical Measurements, Chelsea, MI, Lewis Publishers.
Zorn, M. E., R. D. Gibbons, and W. C. Sonzogni (1997). “Weighted Least Squares Approach to Calculating
Limits of Detection and Quantification by Modeling Variability as a Function of Concentration,” Anal.
Chem., 69(15), 3069–3075.
Exercises
14.1 Method Detection Limit. Determine the method limit of detection using the two sets of eight
replicates.
Replicate Set 1 1.27 1.67 1.36 1.60 1.24 1.26 0.55 0.78
Replicate Set 2 2.56 1.43 1.20 1.21 1.93 2.31 2.11 2.33
14.2 MDL Update. An analyst has given you the concentrations of eight replicates: 1.3, 1.7, 1.4,
1.6, 1.2, 1.3, 0.6, and 0.8. (a) Calculate the limit of detection. (b) A few days later, the analyst
brings an additional 13 replicate measurements (2.6, 1.4, 1.2, 1.2, 1.9, 2.3, 2.1, 2.3, 1.7, 1.9,
1.7, 2.9, and 1.6) and asks you to recalculate the limit of detection. How will you use these
new data?
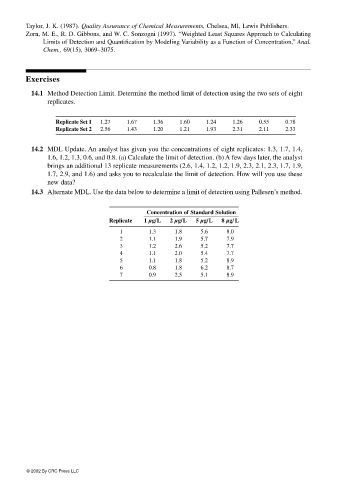
14.3 Alternate MDL. Use the data below to determine a limit of detection using Pallesen’s method.
Concentration of Standard Solution
Replicate 1 µg/L 2 µg/L 5 µg/L 8 µg/ L
1 1.3 1.8 5.6 8.0
2 1.1 1.9 5.7 7.9
3 1.2 2.6 5.2 7.7
4 1.1 2.0 5.4 7.7
5 1.1 1.8 5.2 8.9
6 0.8 1.8 6.2 8.7
7 0.9 2.5 5.1 8.9
© 2002 By CRC Press LLC