
Page 133 - Statistics for Environmental Engineers
P. 133
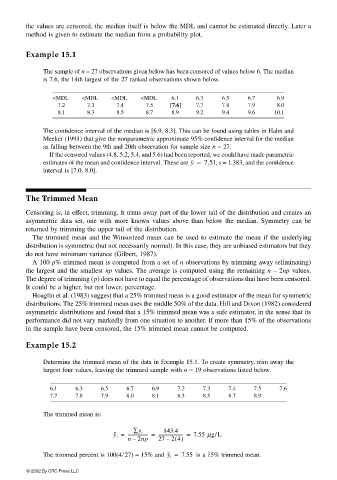
L1592_Frame_C15  Page 130  Tuesday, December 18, 2001  1:50 PM


                       the values are censored, the median itself is below the MDL and cannot be estimated directly. Later a
                       method is given to estimate the median from a probability plot.


                       Example 15.1

                           The sample of n = 27 observations given below has been censored of values below 6. The median
                           is 7.6, the 14th largest of the 27 ranked observations shown below.


                              <MDL    <MDL    <MDL     <MDL    6.1    6.3    6.5    6.7     6.9
                               7.2      7.3     7.4     7.5    [7.6]  7.7    7.8    7.9     8.0
                               8.1      8.3     8.5     8.7    8.9    9.2    9.4    9.6     10.1

                           The confidence interval of the median is [6.9, 8.3]. This can be found using tables in Hahn and
                           Meeker (1991) that give the nonparametric approximate 95% confidence interval for the median
                           as falling between the 9th and 20th observation for sample size n = 27.
                             If the censored values (4.8, 5.2, 5.4, and 5.6) had been reported, we could have made parametric
                           estimates of the mean and confidence interval. These are y =  7.51 , s = 1.383, and the confidence
                           interval is [7.0, 8.0].


                       The Trimmed Mean
                       Censoring is, in effect, trimming. It trims away part of the lower tail of the distribution and creates an
                       asymmetric data set, one with more known values above than below the median. Symmetry can be
                       returned by trimming the upper tail of the distribution.
                        The trimmed mean and the Winsorized mean can be used to estimate the mean if the underlying
                       distribution is symmetric (but not necessarily normal). In this case, they are unbiased estimators but they
                       do not have minimum variance (Gilbert, 1987).
                        A 100 p% trimmed mean is computed from a set of n observations by trimming away (eliminating)
                       the largest and the smallest np values. The average is computed using the remaining n – 2np values.
                       The degree of trimming (p) does not have to equal the percentage of observations that have been censored.
                       It could be a higher, but not lower, percentage.
                        Hoaglin et al. (1983) suggest that a 25% trimmed mean is a good estimator of the mean for symmetric
                       distributions. The 25% trimmed mean uses the middle 50% of the data. Hill and Dixon (1982) considered
                       asymmetric distributions and found that a 15% trimmed mean was a safe estimator, in the sense that its
                       performance did not vary markedly from one situation to another. If more than 15% of the observations
                       in the sample have been censored, the 15% trimmed mean cannot be computed.
                       Example 15.2

                           Determine the trimmed mean of the data in Example 15.1. To create symmetry, trim away the
                           largest four values, leaving the trimmed sample with n = 19 observations listed below.

                             6.1    6.3    6.5     6.7    6.9    7.2    7.3    7.4    7.5    7.6
                             7.7    7.8    7.9     8.0    8.1    8.3    8.5    8.7    8.9

                           The trimmed mean is:

                                                             143.4
                                               y t =  ------------------ =  ----------------------- =  7.55 µg/L
                                                    ∑y i
                                                    –
                                                              –
                                                   n 2np   27 2 4()
                           The trimmed percent is 100(4/27) = 15% and  y t =  7.55   is a 15% trimmed mean.
                       © 2002 By CRC Press LLC