Page 138 - Statistics for Environmental Engineers
P. 138

L1592_Frame_C15  Page 135  Tuesday, December 18, 2001  1:50 PM
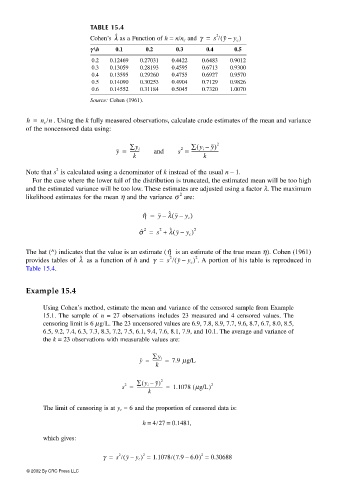


                                        TABLE 15.4
                                        Cohen’s λ as a Function of h = n/n c  and  γ =  s   y – y c )
                                               ˆ
                                                                             (
                                                                            2
                                        γγ γγ \h  0.1   0.2     0.3      0.4     0.5
                                         0.2  0.12469  0.27031  0.4422  0.6483  0.9012
                                         0.3  0.13059  0.28193  0.4595  0.6713  0.9300
                                         0.4  0.13595  0.29260  0.4755  0.6927  0.9570
                                         0.5  0.14090  0.30253  0.4904  0.7129  0.9826
                                         0.6  0.14552  0.31184  0.5045  0.7320  1.0070
                                        Source: Cohen (1961).

                       h =  n c /n  . Using the k fully measured observations, calculate crude estimates of the mean and variance
                       of the noncensored data using:

                                                                      (
                                                y =  ∑y i  and   s =  ∑ y i –  y) 2
                                                                  2
                                                                     ------------------------
                                                   --------
                                                    k                   k
                               2
                       Note that s  is calculated using a denominator of k instead of the usual n – 1.
                        For the case where the lower tail of the distribution is truncated, the estimated mean will be too high
                       and the estimated variance will be too low. These estimates are adjusted using a factor λ. The maximum
                                                                 2
                       likelihood estimates for the mean η and the variance σ   are:
                                                               (
                                                              ˆ
                                                       η ˆ =  y λ y –  y c )
                                                             –
                                                               (
                                                       2
                                                            2
                                                               ˆ
                                                      σ ˆ =  s +  λ y –  y c )  2
                       The hat (^) indicates that the value is an estimate (η ˆ  is an estimate of the true mean η). Cohen (1961)
                                     λ
                       provides tables of   as a function of h and γ =  s   y – y c )  2 . A portion of his table is reproduced in
                                                                (
                                                               2
                                      ˆ
                       Table 15.4.
                       Example 15.4
                           Using Cohen’s method, estimate the mean and variance of the censored sample from Example
                           15.1.  The sample of  n  = 27 observations includes 23 measured and 4 censored  values.  The
                           censoring limit is 6 µg/L. The 23 uncensored values are 6.9, 7.8, 8.9, 7.7, 9.6, 8.7, 6.7, 8.0, 8.5,
                           6.5, 9.2, 7.4, 6.3, 7.3, 8.3, 7.2, 7.5, 6.1, 9.4, 7.6, 8.1, 7.9, and 10.1. The average and variance of
                           the k = 23 observations with measurable values are:


                                                      y =  -------- =  7.9 µg/L
                                                          ∑y i
                                                           k
                                                       (
                                                     ------------------------ =
                                                 s =  ∑ y i –  y)  2  1.1078 µg/L(  ) 2
                                                  2
                                                         k
                           The limit of censoring is at y c  = 6 and the proportion of censored data is:
                                                       h = 4 /27 = 0.1481,

                           which gives:

                                            γ =  s / y –  y c ) =  1.1078/ 7.9 6.0) =  0.30688
                                                  (
                                                                (
                                                                       2
                                                2
                                                       2
                                                                   –
                       © 2002 By CRC Press LLC
   133   134   135   136   137   138   139   140   141   142   143