
Page 115 - Statistics for Environmental Engineers
P. 115
L1592_frame_C12.fm Page 111 Tuesday, December 18, 2001 1:48 PM
The idea of using charts to assist operation is valid in all processes. Plotting the data in different
forms — as time series, Cusums, moving averages — has great value and will reveal most of the important
information to the thoughtful operator. Charts are not inferior or second-class statistical methods. They
reflect the best of control chart philosophy without the statistical complications. They are statistically
valid, easy to use, and not likely to lead to any serious misinterpretations.
Control charts, with formal action limits, are only dressed-up graphs. The control limits add a measure
of objectivity, provided they are established without violating the underlying statistical conditions
(independence, constant variance, and normally distributed variations). If you are not sure how to derive
correct control limits, then use the charts without control limits, or construct an external reference
distribution (Chapter 6) to develop approximate control limits. Take advantage of the human ability to
recognize patterns and deviations from trends, and to reason sensibly.
Some special characteristics of environmental data include serial correlation, seasonality, nonnormal
distributions, and changing variance. Nonnormal distribution and nonconstant variance can usually be
handled with a transformation. Serial correlation and seasonality are problems because control charts
are sensitive to these properties. One way to deal with this is the Six Sigma approach of arbitrarily widening
the control limits to provide a margin for drift.
The next chapter deals with special control charts. Cumulative score charts are an extension of Cusum
charts that can detect cyclic patterns and shifts in the parameters of models. Exponentially weighted
moving average charts can deal with serial correlation and process drift.
References
ASTM (1998). Standard Guide for Developing Appropriate Statistical Approaches for Groundwater Detection
Monitoring Programs, Washington, D.C., D 6312 , U.S. Government Printing Office.
Berthouex, P. M., W. G. Hunter, and L. Pallesen (1978). “Monitoring Sewage Treatment Plants: Some Quality
Control Aspects,” J. Qual. Tech., 10(4).
Box, G. E. P. and A. Luceno (1997). Statistical Control by Monitoring and Feedback Adjustment, New York,
Wiley Interscience.
Box, G. E. P. and L. Luceno (2000). “Six Sigma, Process Drift, Capability Indices, and Feedback Adjustment,”
Qual. Engineer., 12(3), 297–302.
Page, E. S. (1961). “Continuous Inspection Schemes,” Biometrika, 41, 100–115.
Page, E. S. (1961). “Cumulative Sum Charts,” Technometrics, 3, 1–9.
Shewhart, W. A. (1931). Economic Control of Quality of Manufacturing Product, Princeton, NJ, Van Nostrand
Reinhold.
Tiao, G. et al., Eds. (2000). Box on Quality and Discovery with Design, Control, and Robustness, New York,
John Wiley & Sons.
Exercises
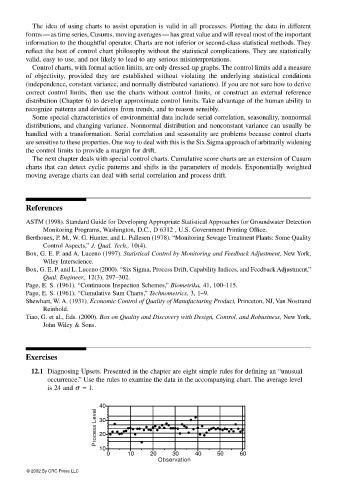
12.1 Diagnosing Upsets. Presented in the chapter are eight simple rules for defining an “unusual
occurrence.” Use the rules to examine the data in the accompanying chart. The average level
is 24 and σ = 1.
40
Process Level 30
20
10
0 10 20 30 40 50 60
Observation
© 2002 By CRC Press LLC