Page 113 - Statistics for Environmental Engineers
P. 113

L1592_frame_C12.fm  Page 109  Tuesday, December 18, 2001  1:48 PM


                                           13

                                         y 12
                                           11

                                           10

                                          MA (5)  13                 3 σ limit

                                           12


                                                                      3 σ limit
                                           11
                                          EWMA  13    3 σ limit              λ = 0.5

                                           12

                                                             3 σ limit
                                           11
                                             0      30      60     90     120    150
                                                           Observation


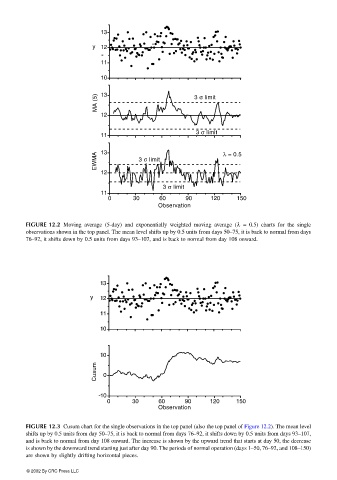
                       FIGURE 12.2  Moving  average (5-day) and  exponentially weighted moving  average  (λ  = 0.5) charts for the single
                       observations shown in the top panel. The mean level shifts up by 0.5 units from days 50–75, it is back to normal from days
                       76–92, it shifts down by 0.5 units from days 93–107, and is back to normal from day 108 onward.


                                           13
                                         y  12

                                           11

                                           10


                                           10
                                          Cusum  0


                                           -1 0
                                             0      30     60      90     120    150
                                                           Observation


                       FIGURE 12.3  Cusum chart for the single observations in the top panel (also the top panel of Figure 12.2). The mean level
                       shifts up by 0.5 units from day 50–75, it is back to normal from days 76–92, it shifts down by 0.5 units from days 93–107,
                       and is back to normal from day 108 onward. The increase is shown by the upward trend that starts at day 50, the decrease
                       is shown by the downward trend starting just after day 90. The periods of normal operation (days 1–50, 76–92, and 108–150)
                       are shown by slightly drifting horizontal pieces.
                       © 2002 By CRC Press LLC
   108   109   110   111   112   113   114   115   116   117   118