
Page 247 - Statistics for Environmental Engineers
P. 247
L1592_frame_C28.fm Page 250 Tuesday, December 18, 2001 2:48 PM
It was necessary to measure the oxygen concentration in the influent to a pilot plant reactor. The influent
was under 20 psig pressure and was aerated with pure oxygen. The dissolved oxygen (DO) concentration
was expected to be about 40 mg/L. Sampling methods that are satisfactory at low DO levels (e.g., below
saturation) will not work in this situation. Also, conventional methods for measuring dissolved oxygen
are not designed to measure DO above about 20 mg/L. The sampling method that was developed involved
withdrawing the highly oxygenated stream into a volume of deoxygenated water, thereby diluting the DO
so it could be measured using conventional methods. The estimated in situ DO of the influent was the
measured DO multiplied by the dilution factor.
There was a possibility that small bubbles would form and oxygen would be lost as the pressure
dropped from 20 psig in the reactor to atmospheric pressure in the dilution bottle. It was essential to
mix the pressurized solution with the dilution water in a way that would eliminate, or at least minimize,
this loss. One possible technique would be to try to capture the oxygen before bubbles formed or escaped
by introducing the sample at a high rate into a stirred bottle containing a large amount of dilution water.
On the other hand, the technique would be more convenient if stirring could be eliminated, if a low
sample flow rate could be used, and if only a small amount of dilution water was needed. Perhaps one
or all of these simplifications could be made. An experiment was needed that would indicate which of
these variables were important in a particular context. The outcome of this experiment should indicate
how the sampling technique could be simplified without loss of accuracy.
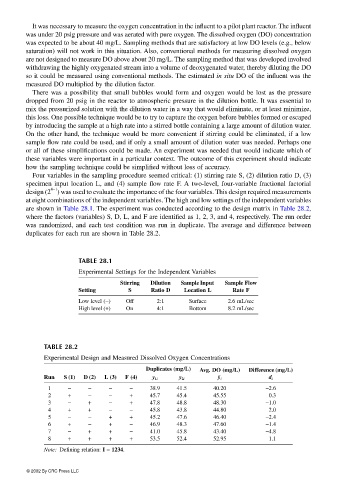
Four variables in the sampling procedure seemed critical: (1) stirring rate S, (2) dilution ratio D, (3)
specimen input location L, and (4) sample flow rate F. A two-level, four-variable fractional factorial
4−1
design (2 ) was used to evaluate the importance of the four variables. This design required measurements
at eight combinations of the independent variables. The high and low settings of the independent variables
are shown in Table 28.1. The experiment was conducted according to the design matrix in Table 28.2,
where the factors (variables) S, D, L, and F are identified as 1, 2, 3, and 4, respectively. The run order
was randomized, and each test condition was run in duplicate. The average and difference between
duplicates for each run are shown in Table 28.2.
TABLE 28.1
Experimental Settings for the Independent Variables
Stirring Dilution Sample Input Sample Flow
Setting S Ratio D Location L Rate F
Low level (−) Off 2:1 Surface 2.6 mL/sec
High level (+) On 4:1 Bottom 8.2 mL/sec
TABLE 28.2
Experimental Design and Measured Dissolved Oxygen Concentrations
Duplicates (mg/L) Avg. DO (mg/L) Difference (mg/L)
Run S (1) D (2) L (3) F (4) y 1i y 2i y i d i
1 − − − − 38.9 41.5 40.20 −2.6
2 + − − + 45.7 45.4 45.55 0.3
3 − + − + 47.8 48.8 48.30 −1.0
4 + + − − 45.8 43.8 44.80 2.0
5 − − + + 45.2 47.6 46.40 −2.4
6 + − + − 46.9 48.3 47.60 −1.4
7 − + + − 41.0 45.8 43.40 −4.8
8 + + + + 53.5 52.4 52.95 1.1
Note: Defining relation: I = 1234.
© 2002 By CRC Press LLC