
Page 258 - Statistics for Environmental Engineers
P. 258
L1592_Frame_C29 Page 262 Tuesday, December 18, 2001 2:48 PM
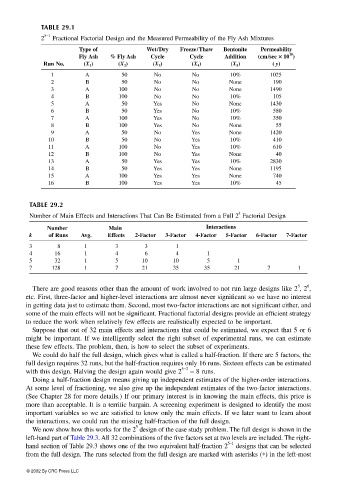
TABLE 29.1
5−1
2 Fractional Factorial Design and the Measured Permeability of the Fly Ash Mixtures
Type of Wet/Dry Freeze/Thaw Bentonite Permeability
10
Fly Ash % Fly Ash Cycle Cycle Addition (cm/sec ×× ×× 10 )
Run No. (X 1 ) (X 2 ) (X 3 ) (X 4 ) (X 5 ) ( y)
1 A 50 No No 10% 1025
2 B 50 No No None 190
3 A 100 No No None 1490
4 B 100 No No 10% 105
5 A 50 Yes No None 1430
6 B 50 Yes No 10% 580
7 A 100 Yes No 10% 350
8 B 100 Yes No None 55
9 A 50 No Yes None 1420
10 B 50 No Yes 10% 410
11 A 100 No Yes 10% 610
12 B 100 No Yes None 40
13 A 50 Yes Yes 10% 2830
14 B 50 Yes Yes None 1195
15 A 100 Yes Yes None 740
16 B 100 Yes Yes 10% 45
TABLE 29.2
k
Number of Main Effects and Interactions That Can Be Estimated from a Full 2 Factorial Design
Number Main Interactions
k of Runs Avg. Effects 2-Factor 3-Factor 4-Factor 5-Factor 6-Factor 7-Factor
3 8 1 3 3 1
4 16 1 4 6 4 1
5 32 1 5 10 10 5 1
7 128 1 7 21 35 35 21 7 1
5 6
There are good reasons other than the amount of work involved to not run large designs like 2 , 2 ,
etc. First, three-factor and higher-level interactions are almost never significant so we have no interest
in getting data just to estimate them. Second, most two-factor interactions are not significant either, and
some of the main effects will not be significant. Fractional factorial designs provide an efficient strategy
to reduce the work when relatively few effects are realistically expected to be important.
Suppose that out of 32 main effects and interactions that could be estimated, we expect that 5 or 6
might be important. If we intelligently select the right subset of experimental runs, we can estimate
these few effects. The problem, then, is how to select the subset of experiments.
We could do half the full design, which gives what is called a half-fraction. If there are 5 factors, the
full design requires 32 runs, but the half-fraction requires only 16 runs. Sixteen effects can be estimated
5−2
with this design. Halving the design again would give 2 = 8 runs.
Doing a half-fraction design means giving up independent estimates of the higher-order interactions.
At some level of fractioning, we also give up the independent estimates of the two-factor interactions.
(See Chapter 28 for more details.) If our primary interest is in knowing the main effects, this price is
more than acceptable. It is a terrific bargain. A screening experiment is designed to identify the most
important variables so we are satisfied to know only the main effects. If we later want to learn about
the interactions, we could run the missing half-fraction of the full design.
5
We now show how this works for the 2 design of the case study problem. The full design is shown in the
left-hand part of Table 29.3. All 32 combinations of the five factors set at two levels are included. The right-
5–1
hand section of Table 29.3 shows one of the two equivalent half-fraction 2 designs that can be selected
from the full design. The runs selected from the full design are marked with asterisks (∗) in the left-most
© 2002 By CRC Press LLC