
Page 260 - Statistics for Environmental Engineers
P. 260
L1592_Frame_C29 Page 264 Tuesday, December 18, 2001 2:48 PM
The two-factor effects are also confounded in the design. Multiplying columns 123 gives a column
identical to 45. As a consequence, the quantity that estimates the 45 interaction also includes the three-
factor interaction of 123 (the 123 and 45 interactions are confounded with each other). Also, 12 = 345,
13 = 245, 14 = 235, 15 = 234, 23 = 145, 24 = 135, 25 = 134, 34 = 125, and 35 = 124. Each two-factor
interaction is confounded with a three-factor interaction. If a two-factor interaction appeared to be
significant, its interpretation would have to take into account the possibility that the effect may be due
in part to the third-order interaction. Fortunately, the third-order interactions are usually small and can
be neglected.
5–1 5
Using the 2 design instead of the full 2 saves us 16 runs, but at the cost of having the main effects
confounded with four-factor interactions and having the two-factor interactions confounded with three-
factor interactions. If the objective is mainly to learn about the main effects, and if the four-factor
interactions are small, the design is highly efficient for identifying the most important factors. Further-
more, because each estimated main effect is the average of eight virtually independent comparisons, the
precision of the estimates can be excellent.
Case Study Solution
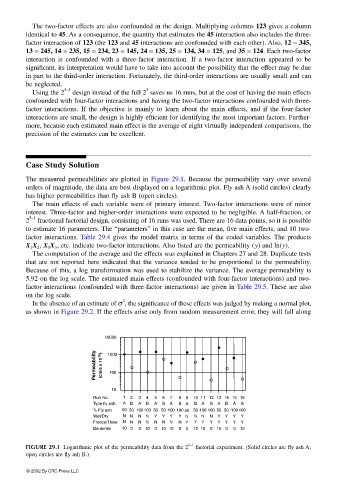
The measured permeabilities are plotted in Figure 29.1. Because the permeability vary over several
orders of magnitude, the data are best displayed on a logarithmic plot. Fly ash A (solid circles) clearly
has higher permeabilities than fly ash B (open circles).
The main effects of each variable were of primary interest. Two-factor interactions were of minor
interest. Three-factor and higher-order interactions were expected to be negligible. A half-fraction, or
5−1
2 fractional factorial design, consisting of 16 runs was used. There are 16 data points, so it is possible
to estimate 16 parameters. The “parameters” in this case are the mean, five main effects, and 10 two-
factor interactions. Table 29.4 gives the model matrix in terms of the coded variables. The products
X 1 X 2 , X 1 X 3 , etc. indicate two-factor interactions. Also listed are the permeability (y) and ln(y).
The computation of the average and the effects was explained in Chapters 27 and 28. Duplicate tests
that are not reported here indicated that the variance tended to be proportional to the permeability.
Because of this, a log transformation was used to stabilize the variance. The average permeability is
5.92 on the log scale. The estimated main effects (confounded with four-factor interactions) and two-
factor interactions (confounded with three-factor interactions) are given in Table 29.5. These are also
on the log scale.
2
In the absence of an estimate of σ , the significance of these effects was judged by making a normal plot,
as shown in Figure 29.2. If the effects arise only from random measurement error, they will fall along
10000
Permeability (cm/s x 10 10 ) 1000
100
10
Run No. 1 2 3 4 5 6 7 8 9 10 11 12 13 14 15 16
Type fly ash A B A B A B A B A B A B A B A B
% Fly ash 50 50 100 100 50 50 100 100 50 50 100 100 50 50 100 100
Wet/Dry N N N N Y Y Y Y N NN N Y Y Y Y
Freeze/Thaw N N N N N N N N Y Y Y Y Y Y Y Y
Bentonite 10 0 0 10 0 10 10 0 0 10 10 0 10 0 0 10
5–1
FIGURE 29.1 Logarithmic plot of the permeability data from the 2 factorial experiment. (Solid circles are fly ash A;
open circles are fly ash B.)
© 2002 By CRC Press LLC