
Page 263 - Statistics for Environmental Engineers
P. 263
L1592_Frame_C29 Page 266 Tuesday, December 18, 2001 2:48 PM
TABLE 29.5
Main Effects and Two-Factor Interactions for the Fly Ash Permeability Study
Estimated Effect
Effect of Factor Confounded Factors (natural log scale)
Average 5.92
Main effects (+four-factor interactions)
Factor 1 1 + 2345 −2.07
Factor 2 2 + 1345 −1.24
Factor 3 3 + 1245 −0.05
Factor 4 4 + 1235 −0.08
Factor 5 5 + 1234 0.17
Two-factor interactions (+three-factor interactions)
Factors 1 and 2 12 + 345 −0.44
Factors 1 and 3 13 + 245 0.01
Factors 1 and 4 14 + 235 −0.29
Factors 1 and 5 15 + 234 0.49
Factors 2 and 3 23 + 145 −0.40
Factors 2 and 4 24 + 135 −0.25
Factors 2 and 5 25 + 134 −0.39
Factors 3 and 4 34 + 125 0.11
Factors 3 and 5 35 + 124 0.04
Factors 4 and 5 45 + 123 0.17
Note: Data were transformed by taking natural logarithms.
2 1
Normal Order Score of Effect -1 (2) % of
0
fly ash
fly ash
-2
-2
-3 (1) Type of -1 0 1
Estimated Effect or Interaction (log scale)
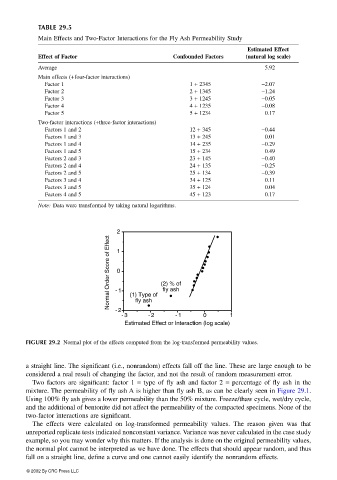
FIGURE 29.2 Normal plot of the effects computed from the log-transformed permeability values.
a straight line. The significant (i.e., nonrandom) effects fall off the line. These are large enough to be
considered a real result of changing the factor, and not the result of random measurement error.
Two factors are significant: factor 1 = type of fly ash and factor 2 = percentage of fly ash in the
mixture. The permeability of fly ash A is higher than fly ash B, as can be clearly seen in Figure 29.1.
Using 100% fly ash gives a lower permeability than the 50% mixture. Freeze/thaw cycle, wet/dry cycle,
and the additional of bentonite did not affect the permeability of the compacted specimens. None of the
two-factor interactions are significant.
The effects were calculated on log-transformed permeability values. The reason given was that
unreported replicate tests indicated nonconstant variance. Variance was never calculated in the case study
example, so you may wonder why this matters. If the analysis is done on the original permeability values,
the normal plot cannot be interpreted as we have done. The effects that should appear random, and thus
fall on a straight line, define a curve and one cannot easily identify the nonrandom effects.
© 2002 By CRC Press LLC