
Page 266 - Statistics for Environmental Engineers
P. 266
L1592_Frame_C29 Page 269 Tuesday, December 18, 2001 2:48 PM
k–p
Box, G. E. P. and J. S. Hunter (1961). “The 2 Fractional Factorial Designs. Part II,” Technometrics, 3(4),
449–458.
Box, G. E. P., W. G. Hunter, and J. S. Hunter (1978). Statistics for Experimenters: An Introduction to Design,
Data Analysis, and Model Building, New York, Wiley Interscience.
Draper, N. R. and H. Smith, (1998). Applied Regression Analysis, 3rd ed., New York, John Wiley.
Exercises
29.1 Fly Ash Case Study. Compute the main and two-factor effects for the fly ash permeability
data without making the log transformation. Make the normal plot and discuss the difficulty
of identifying significant and random effects.
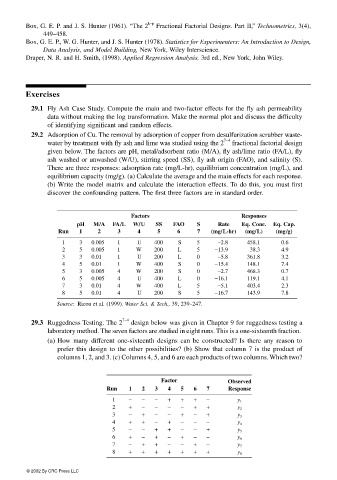
29.2 Adsorption of Cu. The removal by adsorption of copper from desulfurization scrubber waste-
7−4
water by treatment with fly ash and lime was studied using the 2 fractional factorial design
given below. The factors are pH, metal/adsorbent ratio (M/A), fly ash/lime ratio (FA/L), fly
ash washed or unwashed (W/U), stirring speed (SS), fly ash origin (FAO), and salinity (S).
There are three responses: adsorption rate (mg/L-hr), equilibrium concentration (mg/L), and
equilibrium capacity (mg/g). (a) Calculate the average and the main effects for each response.
(b) Write the model matrix and calculate the interaction effects. To do this, you must first
discover the confounding pattern. The first three factors are in standard order.
Factors Responses
pH M/A FA/L W/U SS FAO S Rate Eq. Conc. Eq. Cap.
Run 1 2 3 4 5 6 7 (mg/L-hr) (mg/L) (mg/g)
1 3 0.005 1 U 400 S 5 −2.8 458.1 0.6
2 5 0.005 1 W 200 L 5 −13.9 38.3 4.9
3 3 0.01 1 U 200 L 0 −5.8 361.8 3.2
4 5 0.01 1 W 400 S 0 −15.4 148.1 7.4
5 3 0.005 4 W 200 S 0 −2.7 468.3 0.7
6 5 0.005 4 U 400 L 0 −16.1 119.1 4.1
7 3 0.01 4 W 400 L 5 −5.1 403.4 2.3
8 5 0.01 4 U 200 S 5 −16.7 143.9 7.8
Source: Ricou et al. (1999). Water Sci. & Tech., 39, 239–247.
7−4
29.3 Ruggedness Testing. The 2 design below was given in Chapter 9 for ruggedness testing a
laboratory method. The seven factors are studied in eight runs. This is a one-sixteenth fraction.
(a) How many different one-sixteenth designs can be constructed? Is there any reason to
prefer this design to the other possibilities? (b) Show that column 7 is the product of
columns 1, 2, and 3. (c) Columns 4, 5, and 6 are each products of two columns. Which two?
Factor Observed
Run 1 2 3 4 5 6 7 Response
1 − − − + + + − y 1
2 + − − − − + + y 2
3 − + − − + − + y 3
4 + + − + − − − y 4
5 − − + + − − + y 5
6 + − + − + − − y 6
7 − + + − − + − y 7
8 + + + + + + + y 8
© 2002 By CRC Press LLC