
Page 269 - Statistics for Environmental Engineers
P. 269
L1592_Frame_C30 Page 272 Tuesday, December 18, 2001 2:49 PM
TABLE 30.1
Results for Comparative Tests of Methods A and B
Nitrate NO 3 (mg/L) Average NO 3
y
Level Method PMA y 1 y 2 (mg/L)
Low A None 2.9 2.8 2.85
High A None 26.0 27.0 26.50
Low B None 3.1 2.8 2.95
High B None 30.0 32.0 31.00
Low A Yes 2.9 3.0 2.95
High A Yes 28.0 27.0 27.50
Low B Yes 3.3 3.1 3.20
High B Yes 30.4 31.1 30.75
TABLE 30.2
Design Matrix Expressed in Terms of the Coded Variables
Nitrate
Level Method PMA Level ln(NO 3 ) Average Variance
x s 2
X 1 X 2 X 3 x 1 x 2
−1 −1 −1 1.0647 1.0296 1.0472 0.0006157
1 −1 −1 3.2581 3.2958 3.2770 0.0007122
−1 1 −1 1.1314 1.0296 1.0805 0.0051799
1 1 −1 3.4012 3.4657 3.4335 0.0020826
−1 −1 1 1.0647 1.0986 1.0817 0.0005747
1 −1 1 3.3322 3.2958 3.3140 0.0006613
−1 1 1 1.1939 1.1314 1.1627 0.0019544
1 1 1 3.4144 3.4372 3.4258 0.0002591
Note: Values shown for the logarithms of the duplicate observations, x = ln(y), and their average and
variance.
3 3.
4 30.
1627 1. 3. 4258
1 3.
1 31.
30. 0
1 3.
1.0805
B 4335
3.
32. 0
2.8
Method 2.9 27.0 1m Method 1.0817 3.3140
l
3.0 28.0
PMA
PMA
26. 0
2. 9
A
none 3.2770
1.0472
8 2. 27. 0
NO level NO level
3 3
(a) (b)
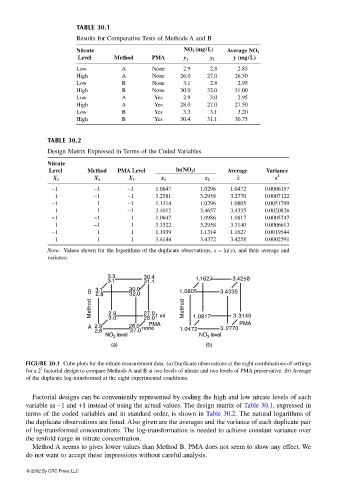
FIGURE 30.1 Cube plots for the nitrate measurement data. (a) Duplicate observations at the eight combinations of settings
3
for a 2 factorial design to compare Methods A and B at two levels of nitrate and two levels of PMA preservative. (b) Average
of the duplicate log-transformed at the eight experimental conditions.
Factorial designs can be conveniently represented by coding the high and low nitrate levels of each
variable as −1 and +1 instead of using the actual values. The design matrix of Table 30.1, expressed in
terms of the coded variables and in standard order, is shown in Table 30.2. The natural logarithms of
the duplicate observations are listed. Also given are the averages and the variance of each duplicate pair
of log-transformed concentrations. The log-transformation is needed to achieve constant variance over
the tenfold range in nitrate concentration.
Method A seems to gives lower values than Method B. PMA does not seem to show any effect. We
do not want to accept these impressions without careful analysis.
© 2002 By CRC Press LLC