
Page 273 - Statistics for Environmental Engineers
P. 273
L1592_Frame_C30 Page 276 Tuesday, December 18, 2001 2:49 PM
Precision of the Estimated Parameters
The variance of the coefficients is:
Var b() = σ /16
2
2
The denominator is 16 is because there are n = 16 observations. In this replicated experiment, σ is
2
estimated by s , which is calculated from the logarithms of the duplicate observations (Table 30.2).
If there were no replication, the variance would be Var(b) = σ /8 for a 2 experimental design, and σ 2
3
2
would be estimated from data external to the design.
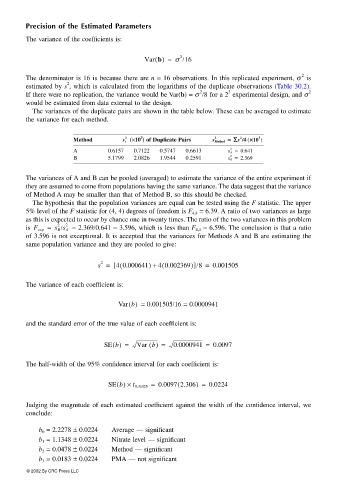
The variances of the duplicate pairs are shown in the table below. These can be averaged to estimate
the variance for each method.
(
3
3
2
2
Method s i 2 (×10 ) of Duplicate Pairs s Method == == ∑∑ ∑ ∑s // //44 44 ×× ××10 )
2
A 0.6157 0.7122 0.5747 0.6613 s A = 0.641
2
B 5.1799 2.0826 1.9544 0.2591 s B = 2.369
The variances of A and B can be pooled (averaged) to estimate the variance of the entire experiment if
they are assumed to come from populations having the same variance. The data suggest that the variance
of Method A may be smaller than that of Method B, so this should be checked.
The hypothesis that the population variances are equal can be tested using the F statistic. The upper
5% level of the F statistic for (4, 4) degrees of freedom is F 4,4 = 6.39. A ratio of two variances as large
as this is expected to occur by chance one in twenty times. The ratio of the two variances in this problem
2
is F exp = s B /s A 2 = 2.369/0.641 = 3.596, which is less than F 4,4 = 6.596. The conclusion is that a ratio
of 3.596 is not exceptional. It is accepted that the variances for Methods A and B are estimating the
same population variance and they are pooled to give:
(
(
s = [ 4 0.000641) + 4 0.002369)]/8 = 0.001505
2
The variance of each coefficient is:
Var b() = 0.001505/16 = 0.0000941
and the standard error of the true value of each coefficient is:
SE b() = Var b() = 0.0000941 = 0.0097
The half-width of the 95% confidence interval for each coefficient is:
(
SE b() × t 8,0.025 = 0.0097 2.306) = 0.0224
Judging the magnitude of each estimated coefficient against the width of the confidence interval, we
conclude:
b 0 = 2.2278 ± 0.0224 Average — significant
b 1 = 1.1348 ± 0.0224 Nitrate level — significant
b 2 = 0.0478 ± 0.0224 Method — significant
b 3 = 0.0183 ± 0.0224 PMA — not significant
© 2002 By CRC Press LLC